Dimensionality Reduction
ChemPlot uses different machine learning techniques to reduce the number of dimensions, or features, of each molecule to only two in order to then create 2D graphs. These algorithms are: PCA [1], t-SNE [2] and UMAP [3].
For the following examples we will use two molecular datasets, already mentioned in the previous section: the BBBP (blood-brain barrier penetration) dataset [4] and the BACE (β-secretase inhibitors) dataset [5].
from chemplot import Plotter, load_data

data_BBBP = load_data("BBBP")
data_BACE = load_data("BACE")
cp_BBBP = Plotter.from_smiles(data_BBBP["smiles"], target=data_BBBP["target"], target_type="C")
cp_BACE = Plotter.from_smiles(data_BACE["smiles"], target=data_BACE["target"], target_type="R")
PCA
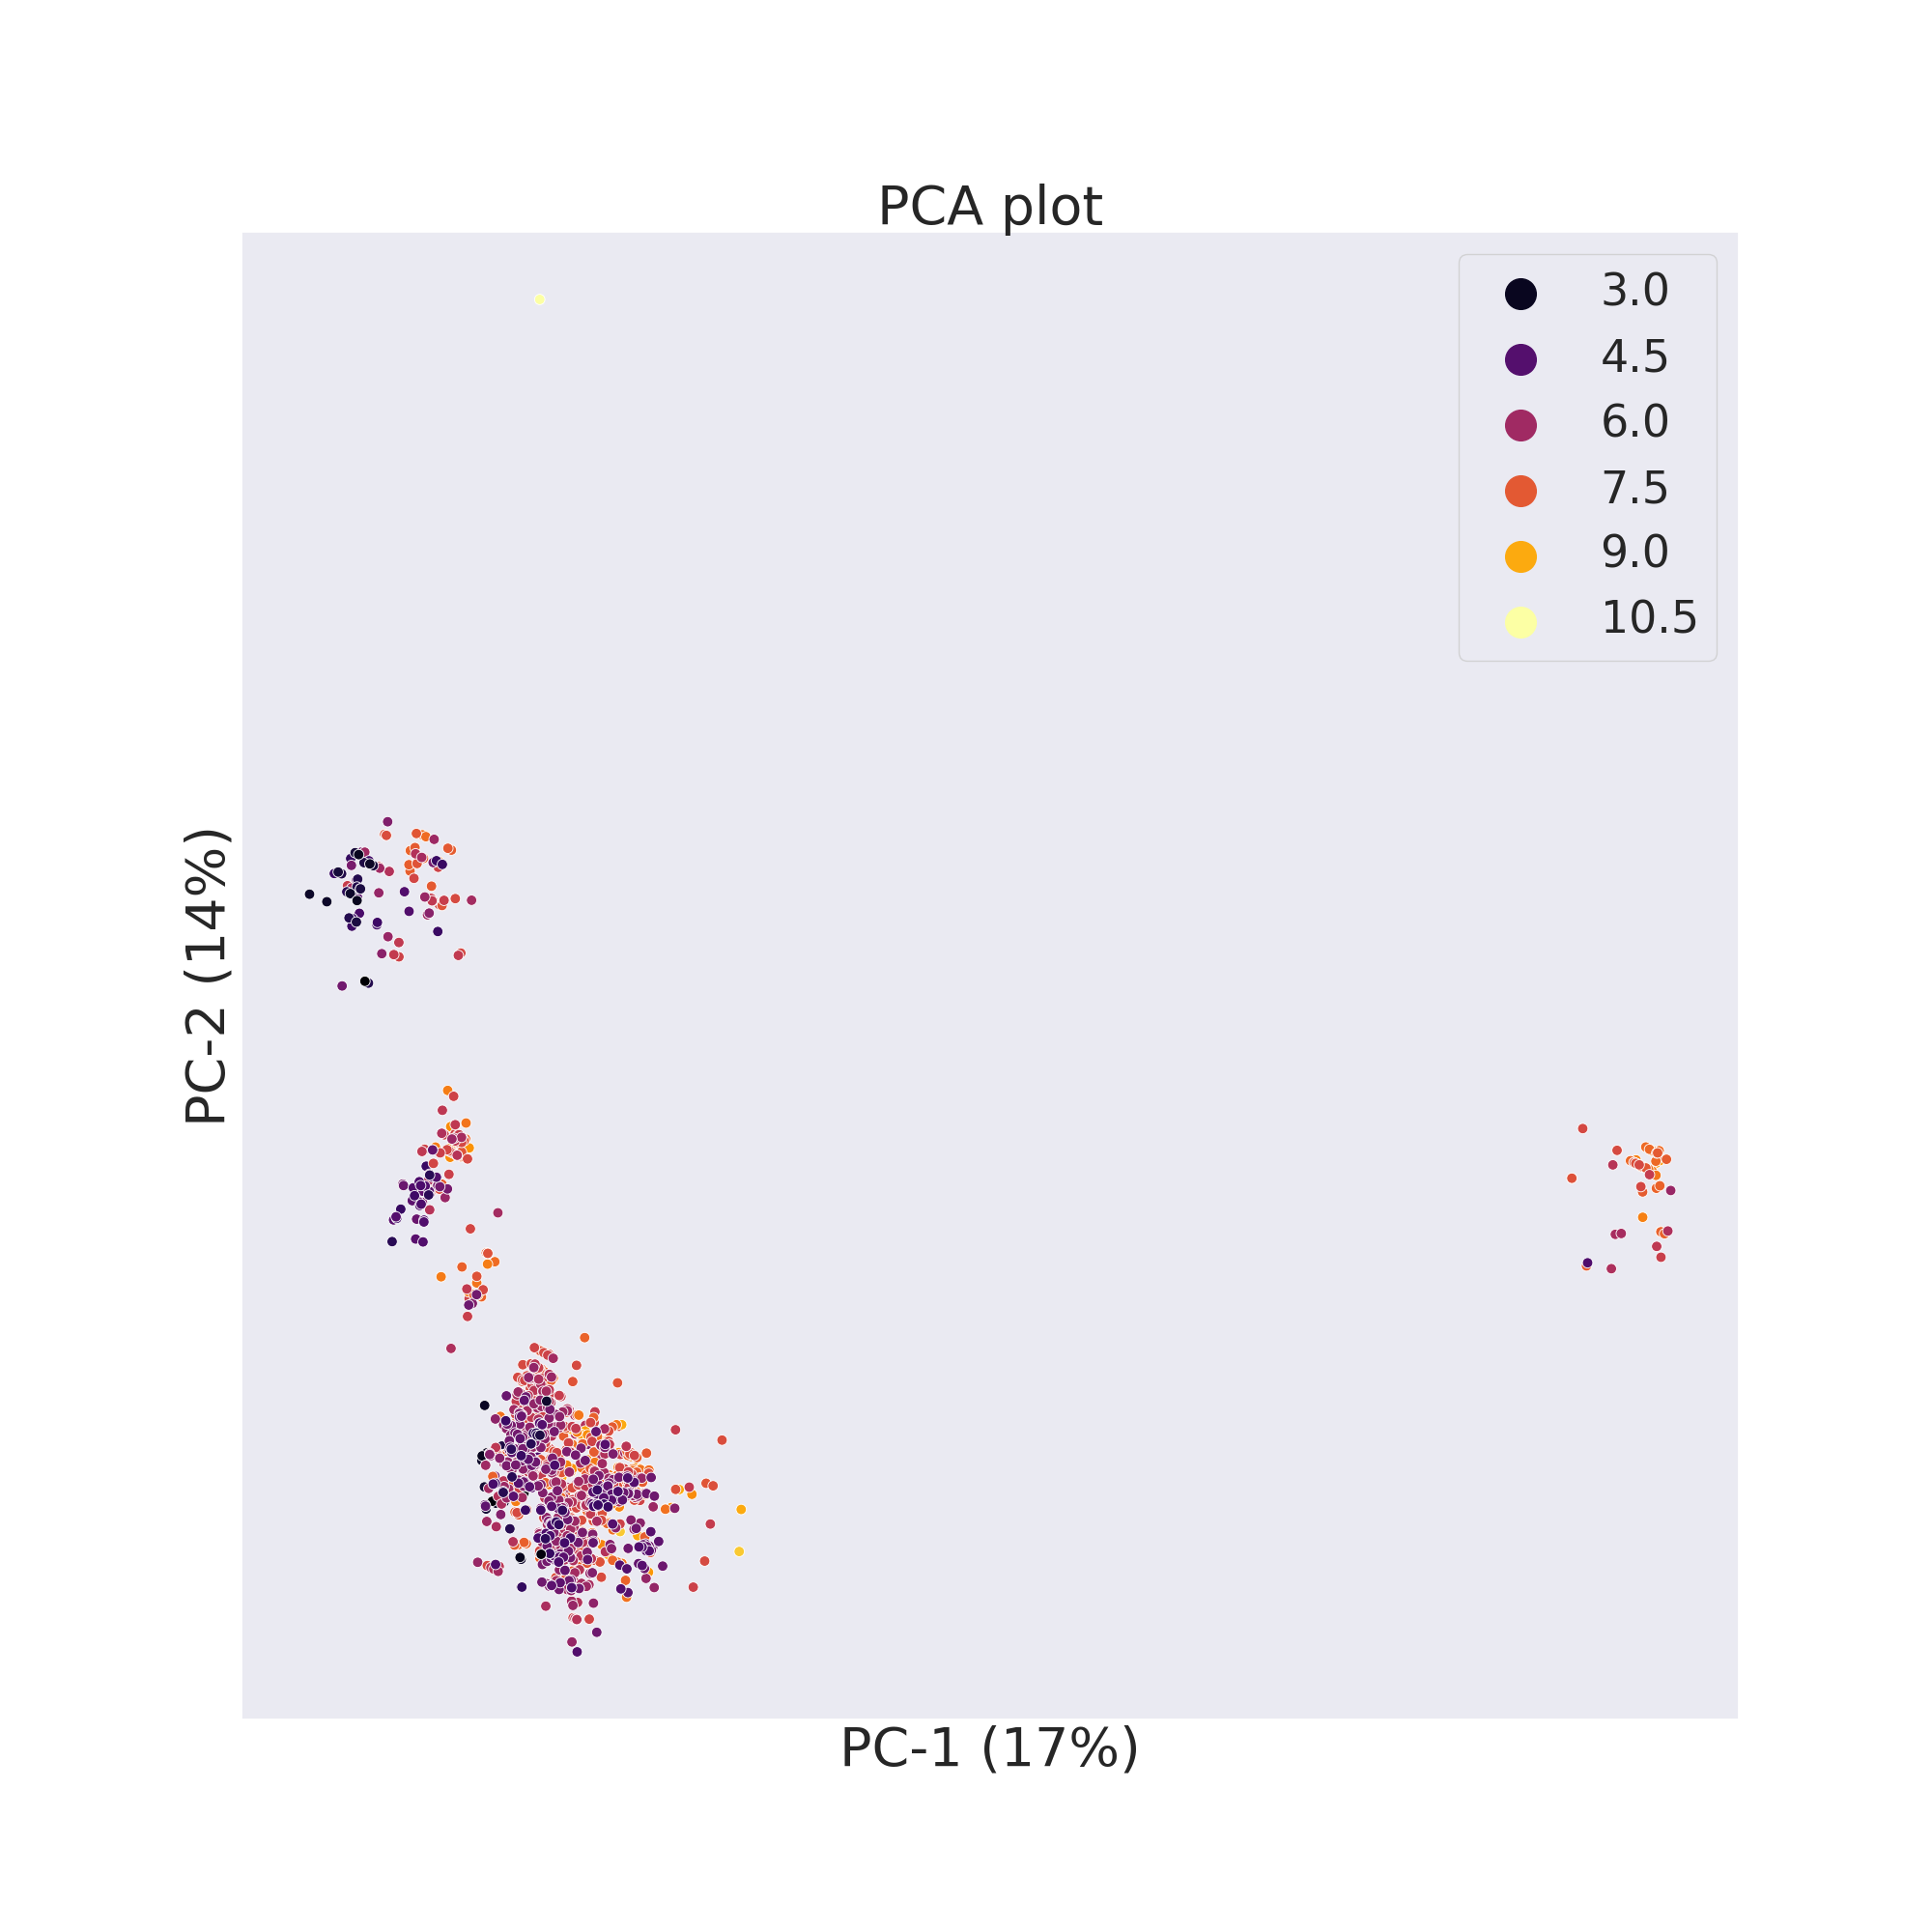
ChemPlot uses PCA from the scikit-learn package to compute the two principal components of the molecular dataset. PCA allows for time efficient results and for a visualization which gives a global view of the data.
cp_BBBP.pca()
cp_BBBP.visualize_plot()
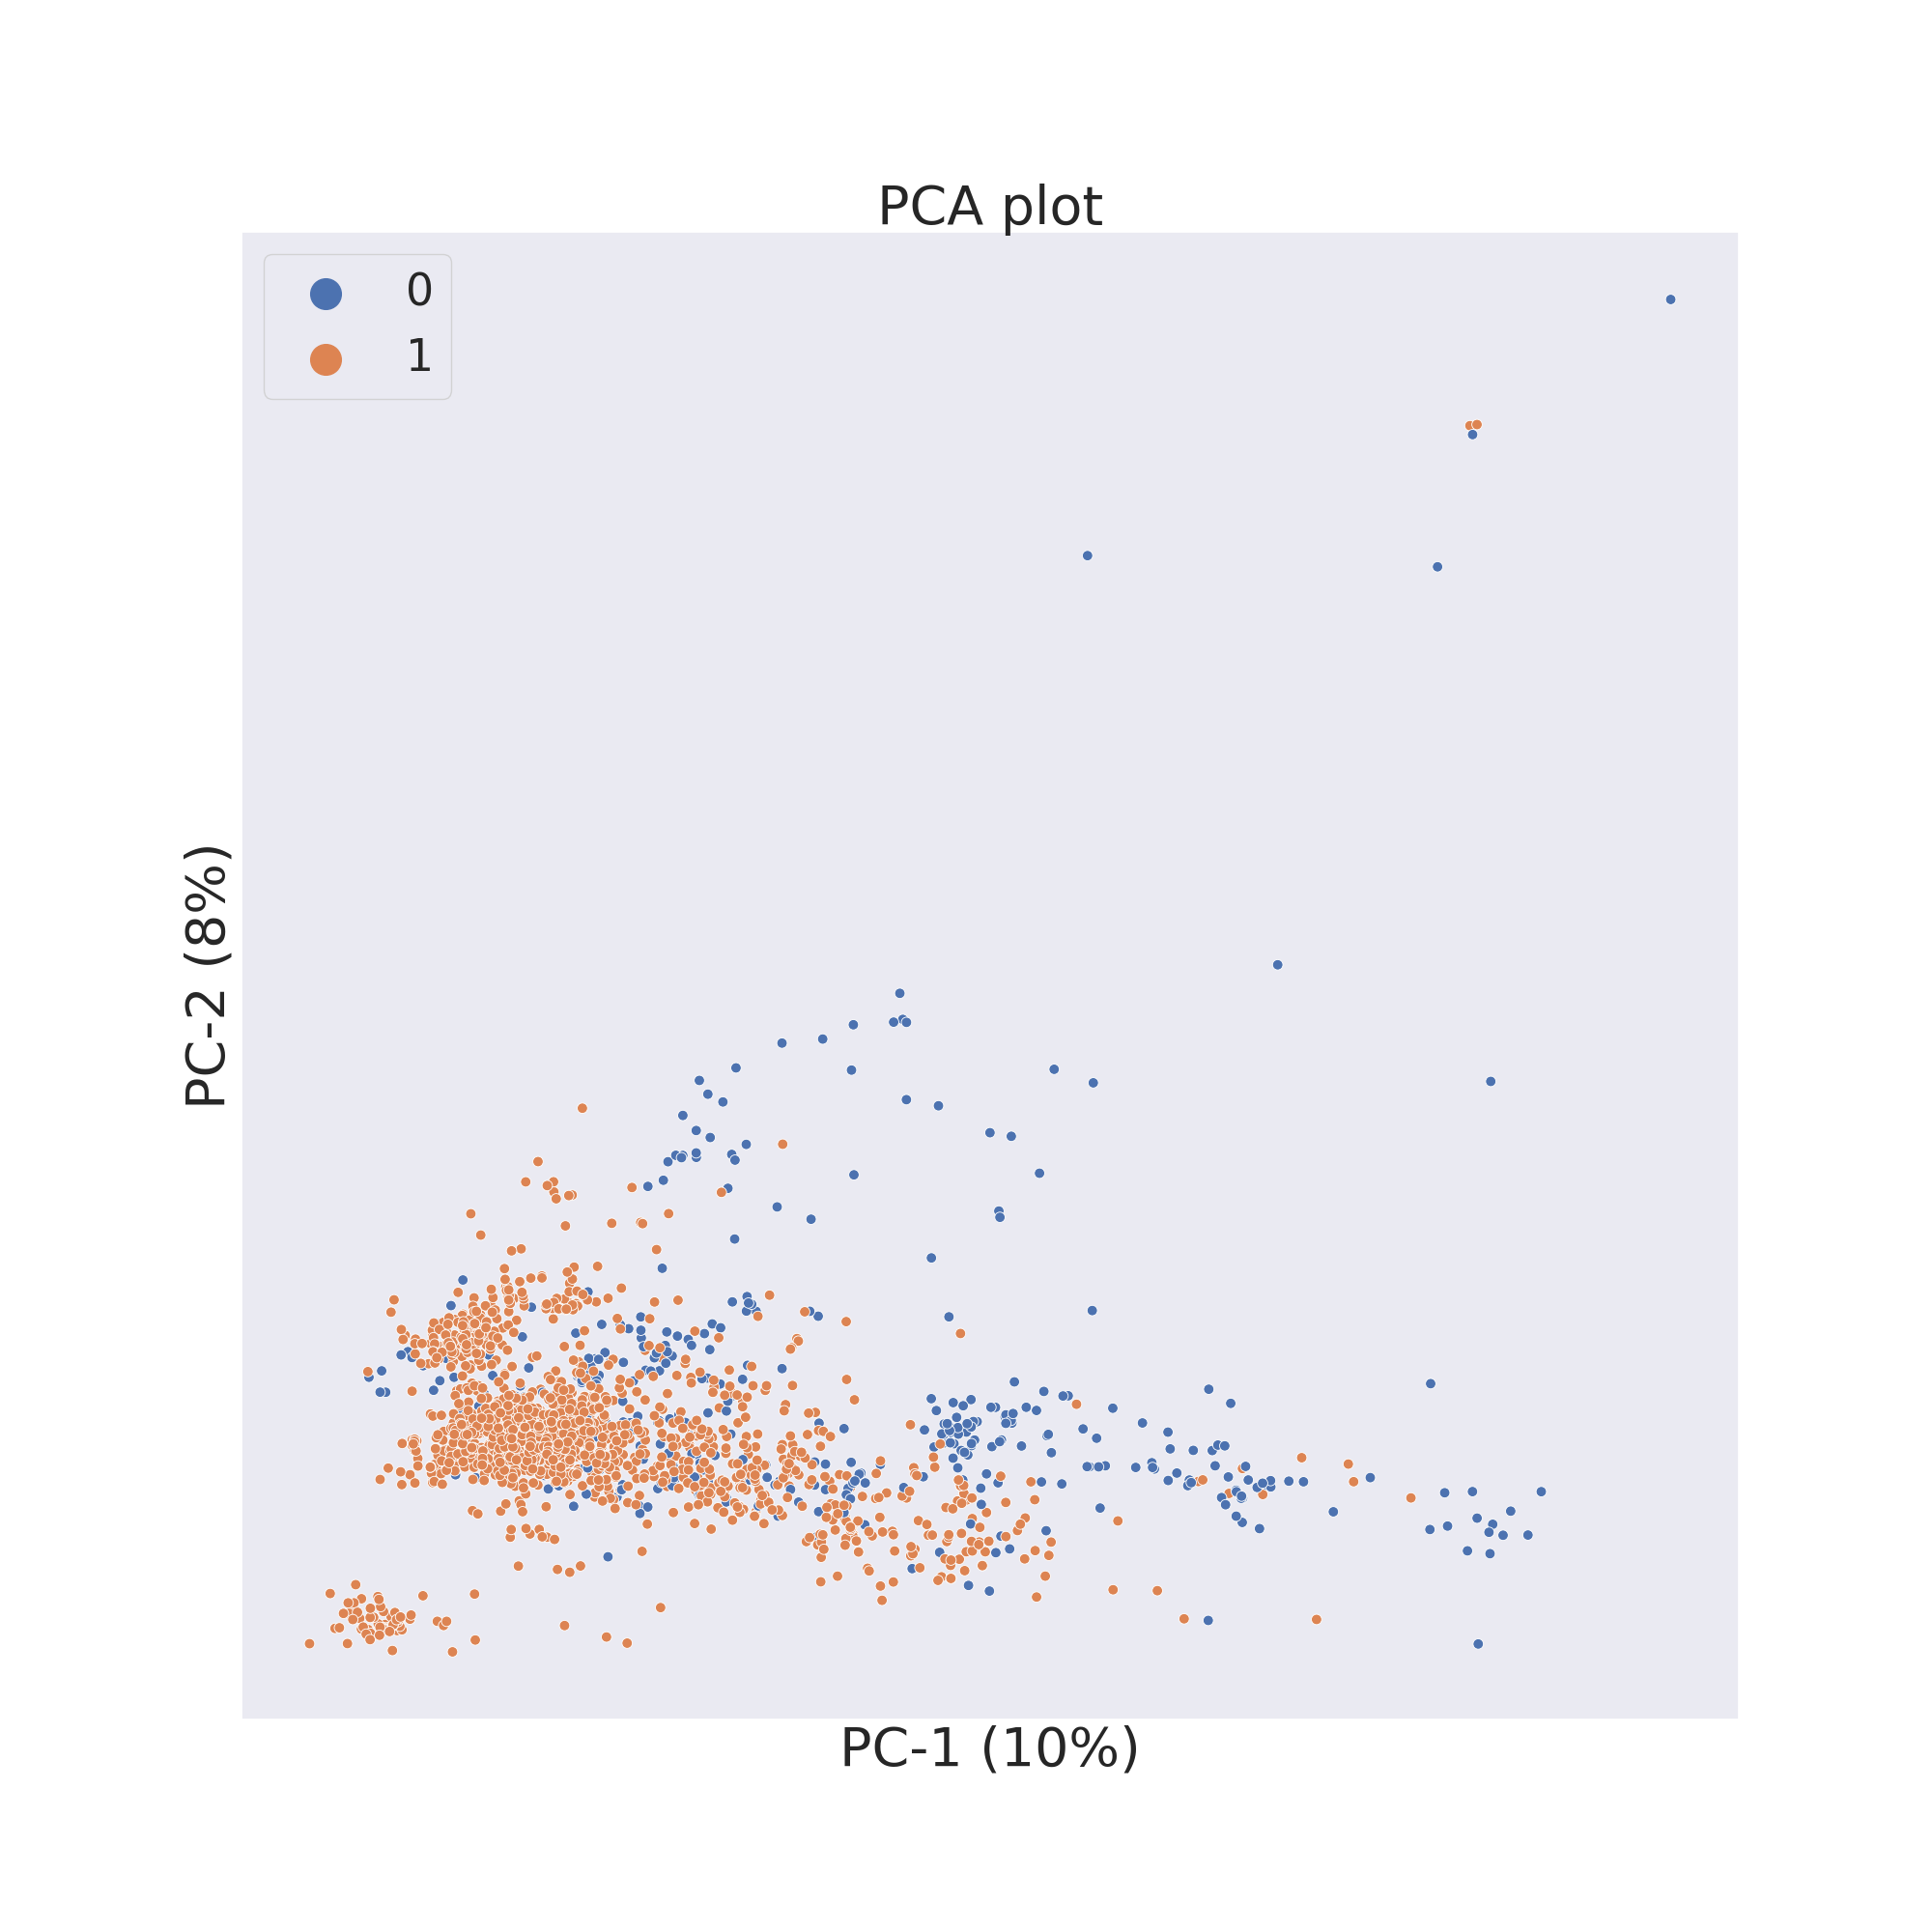
cp_BACE.pca()
cp_BACE.visualize_plot()
t-SNE
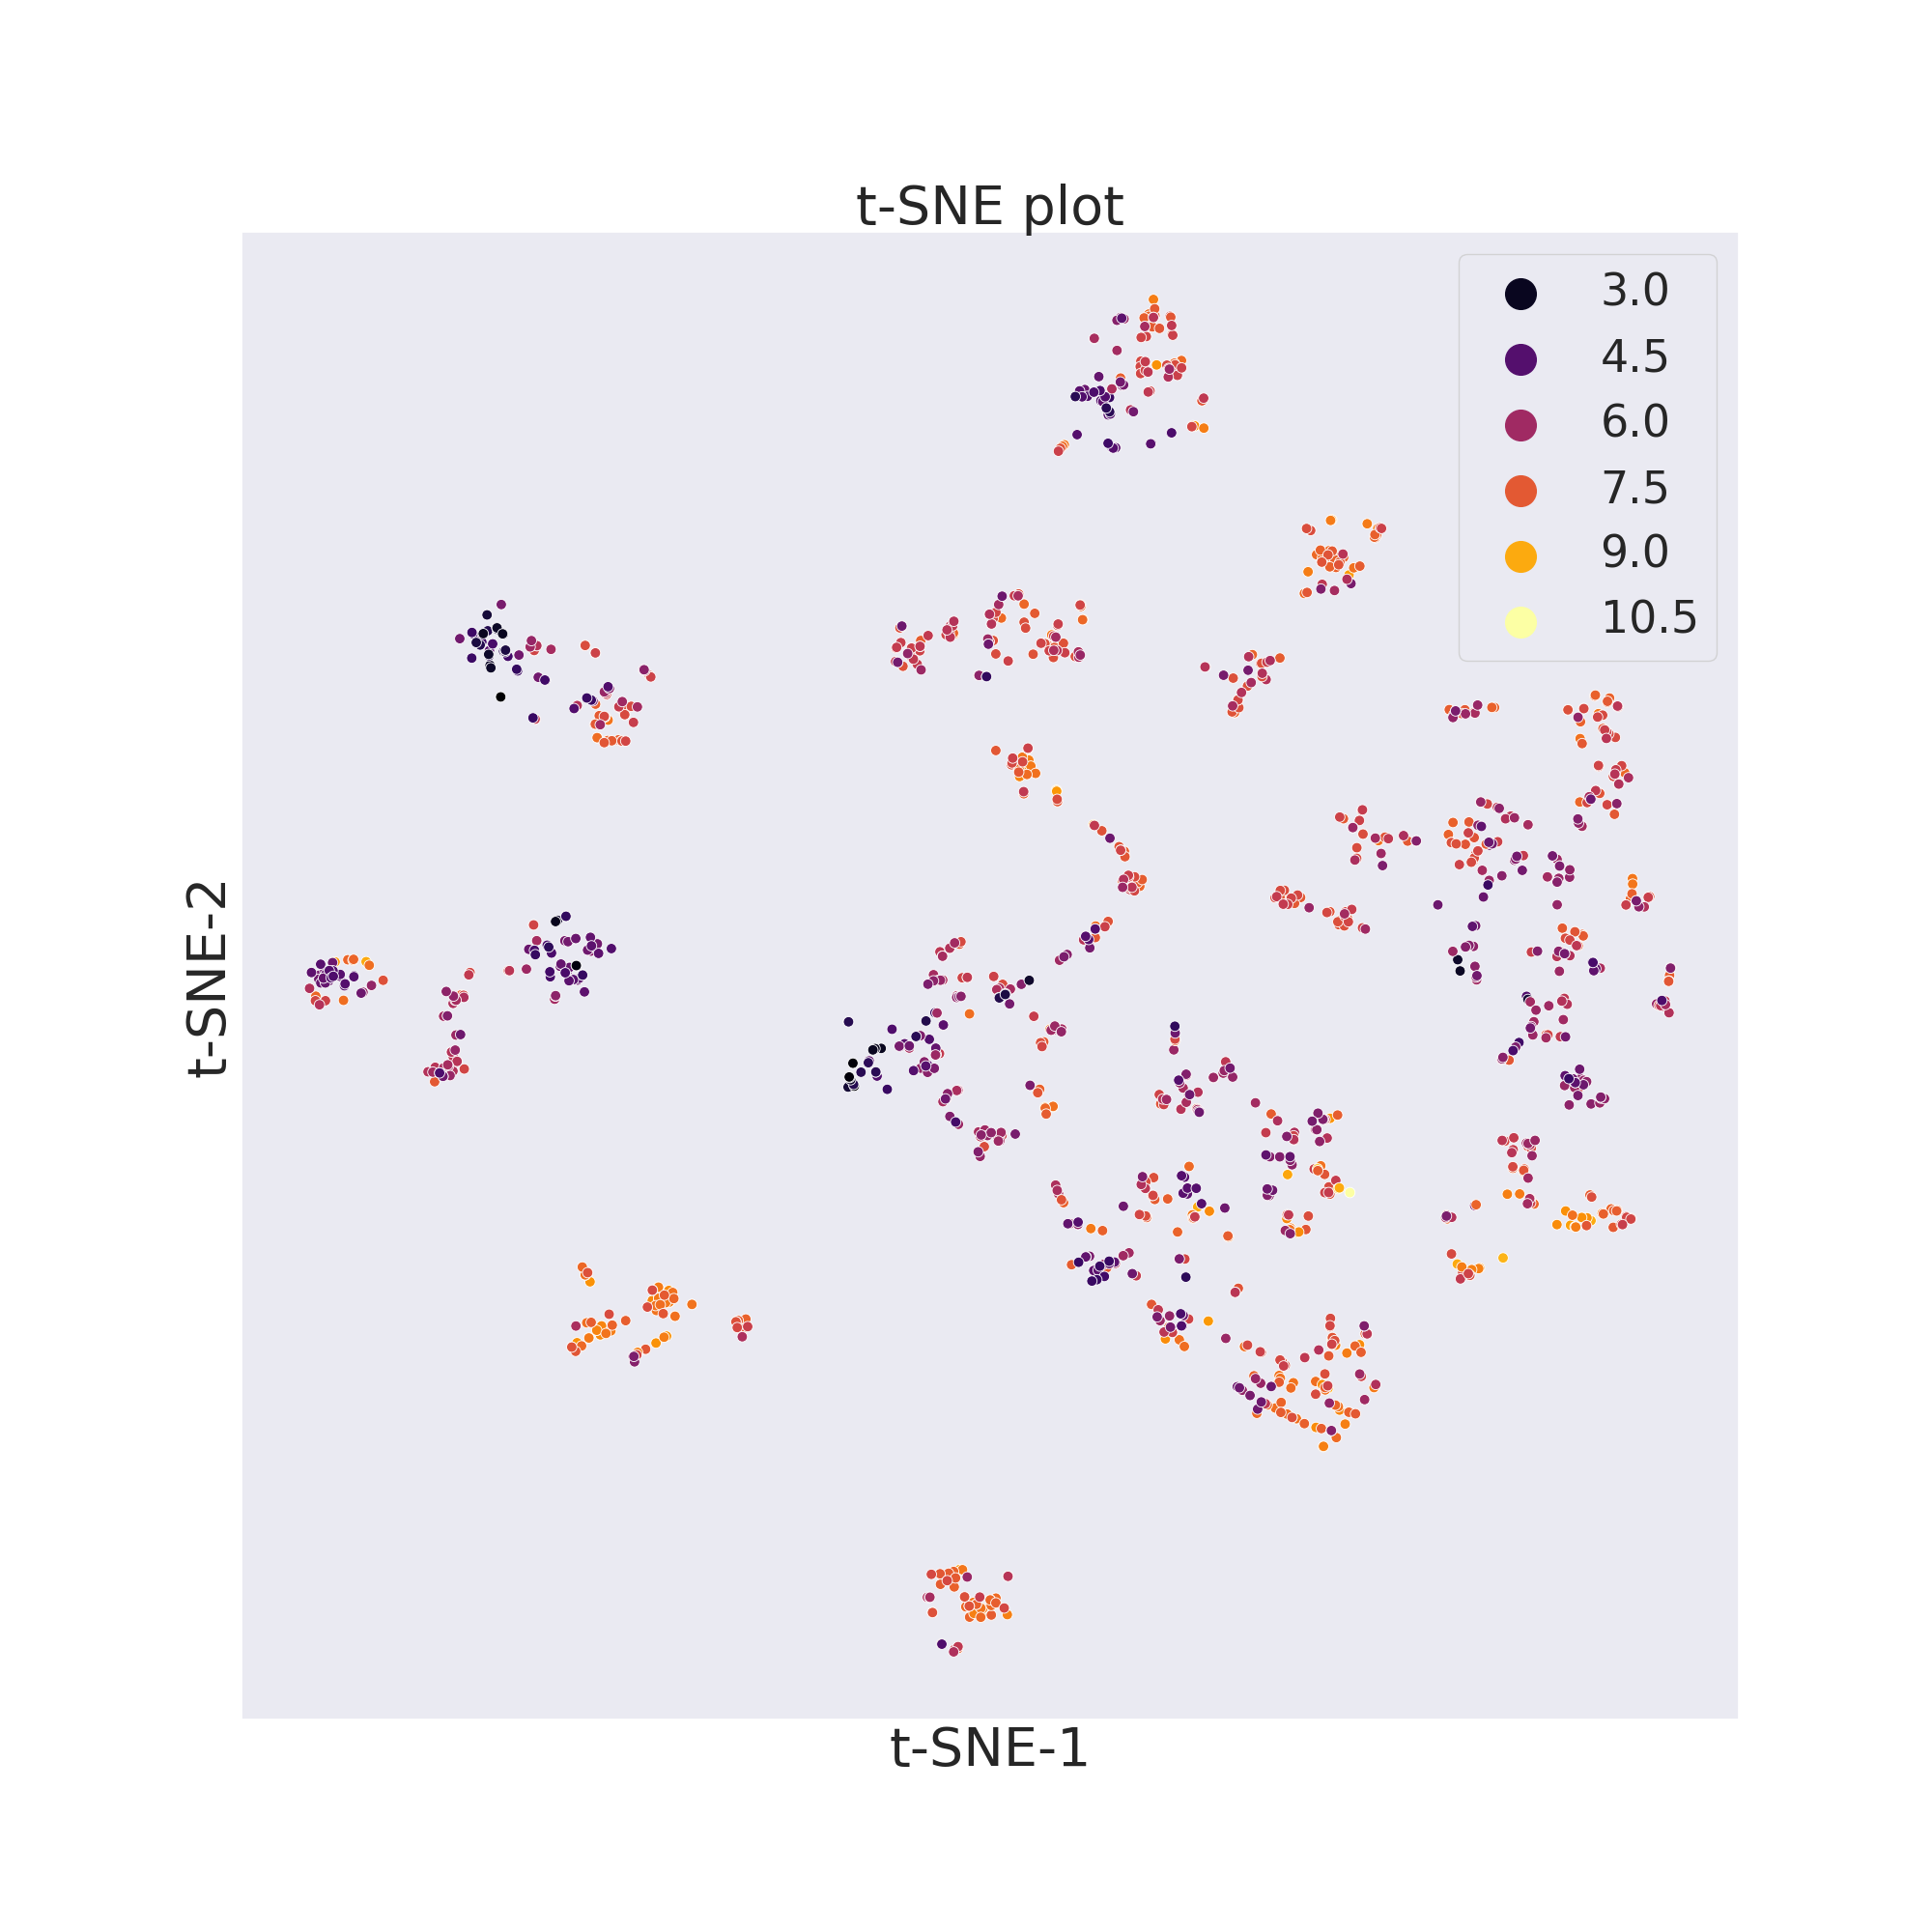
ChemPlot uses t-SNE from the scikit-learn package to reduce to only 2 the number of features of the molecular dataset. t-SNE looks at local neighbourhoods of molecules when it is reducing their dimensions. In this way the local structure of the dataset is better preserved, while the global structure is mostly lost when plotting the results in a 2D graph. However because of the locality preservation that t-SNE offers it is possible to visualize well-defined clusters of similar molecules that exhibit similar properties.
cp_BBBP.tsne()
cp_BBBP.visualize_plot()
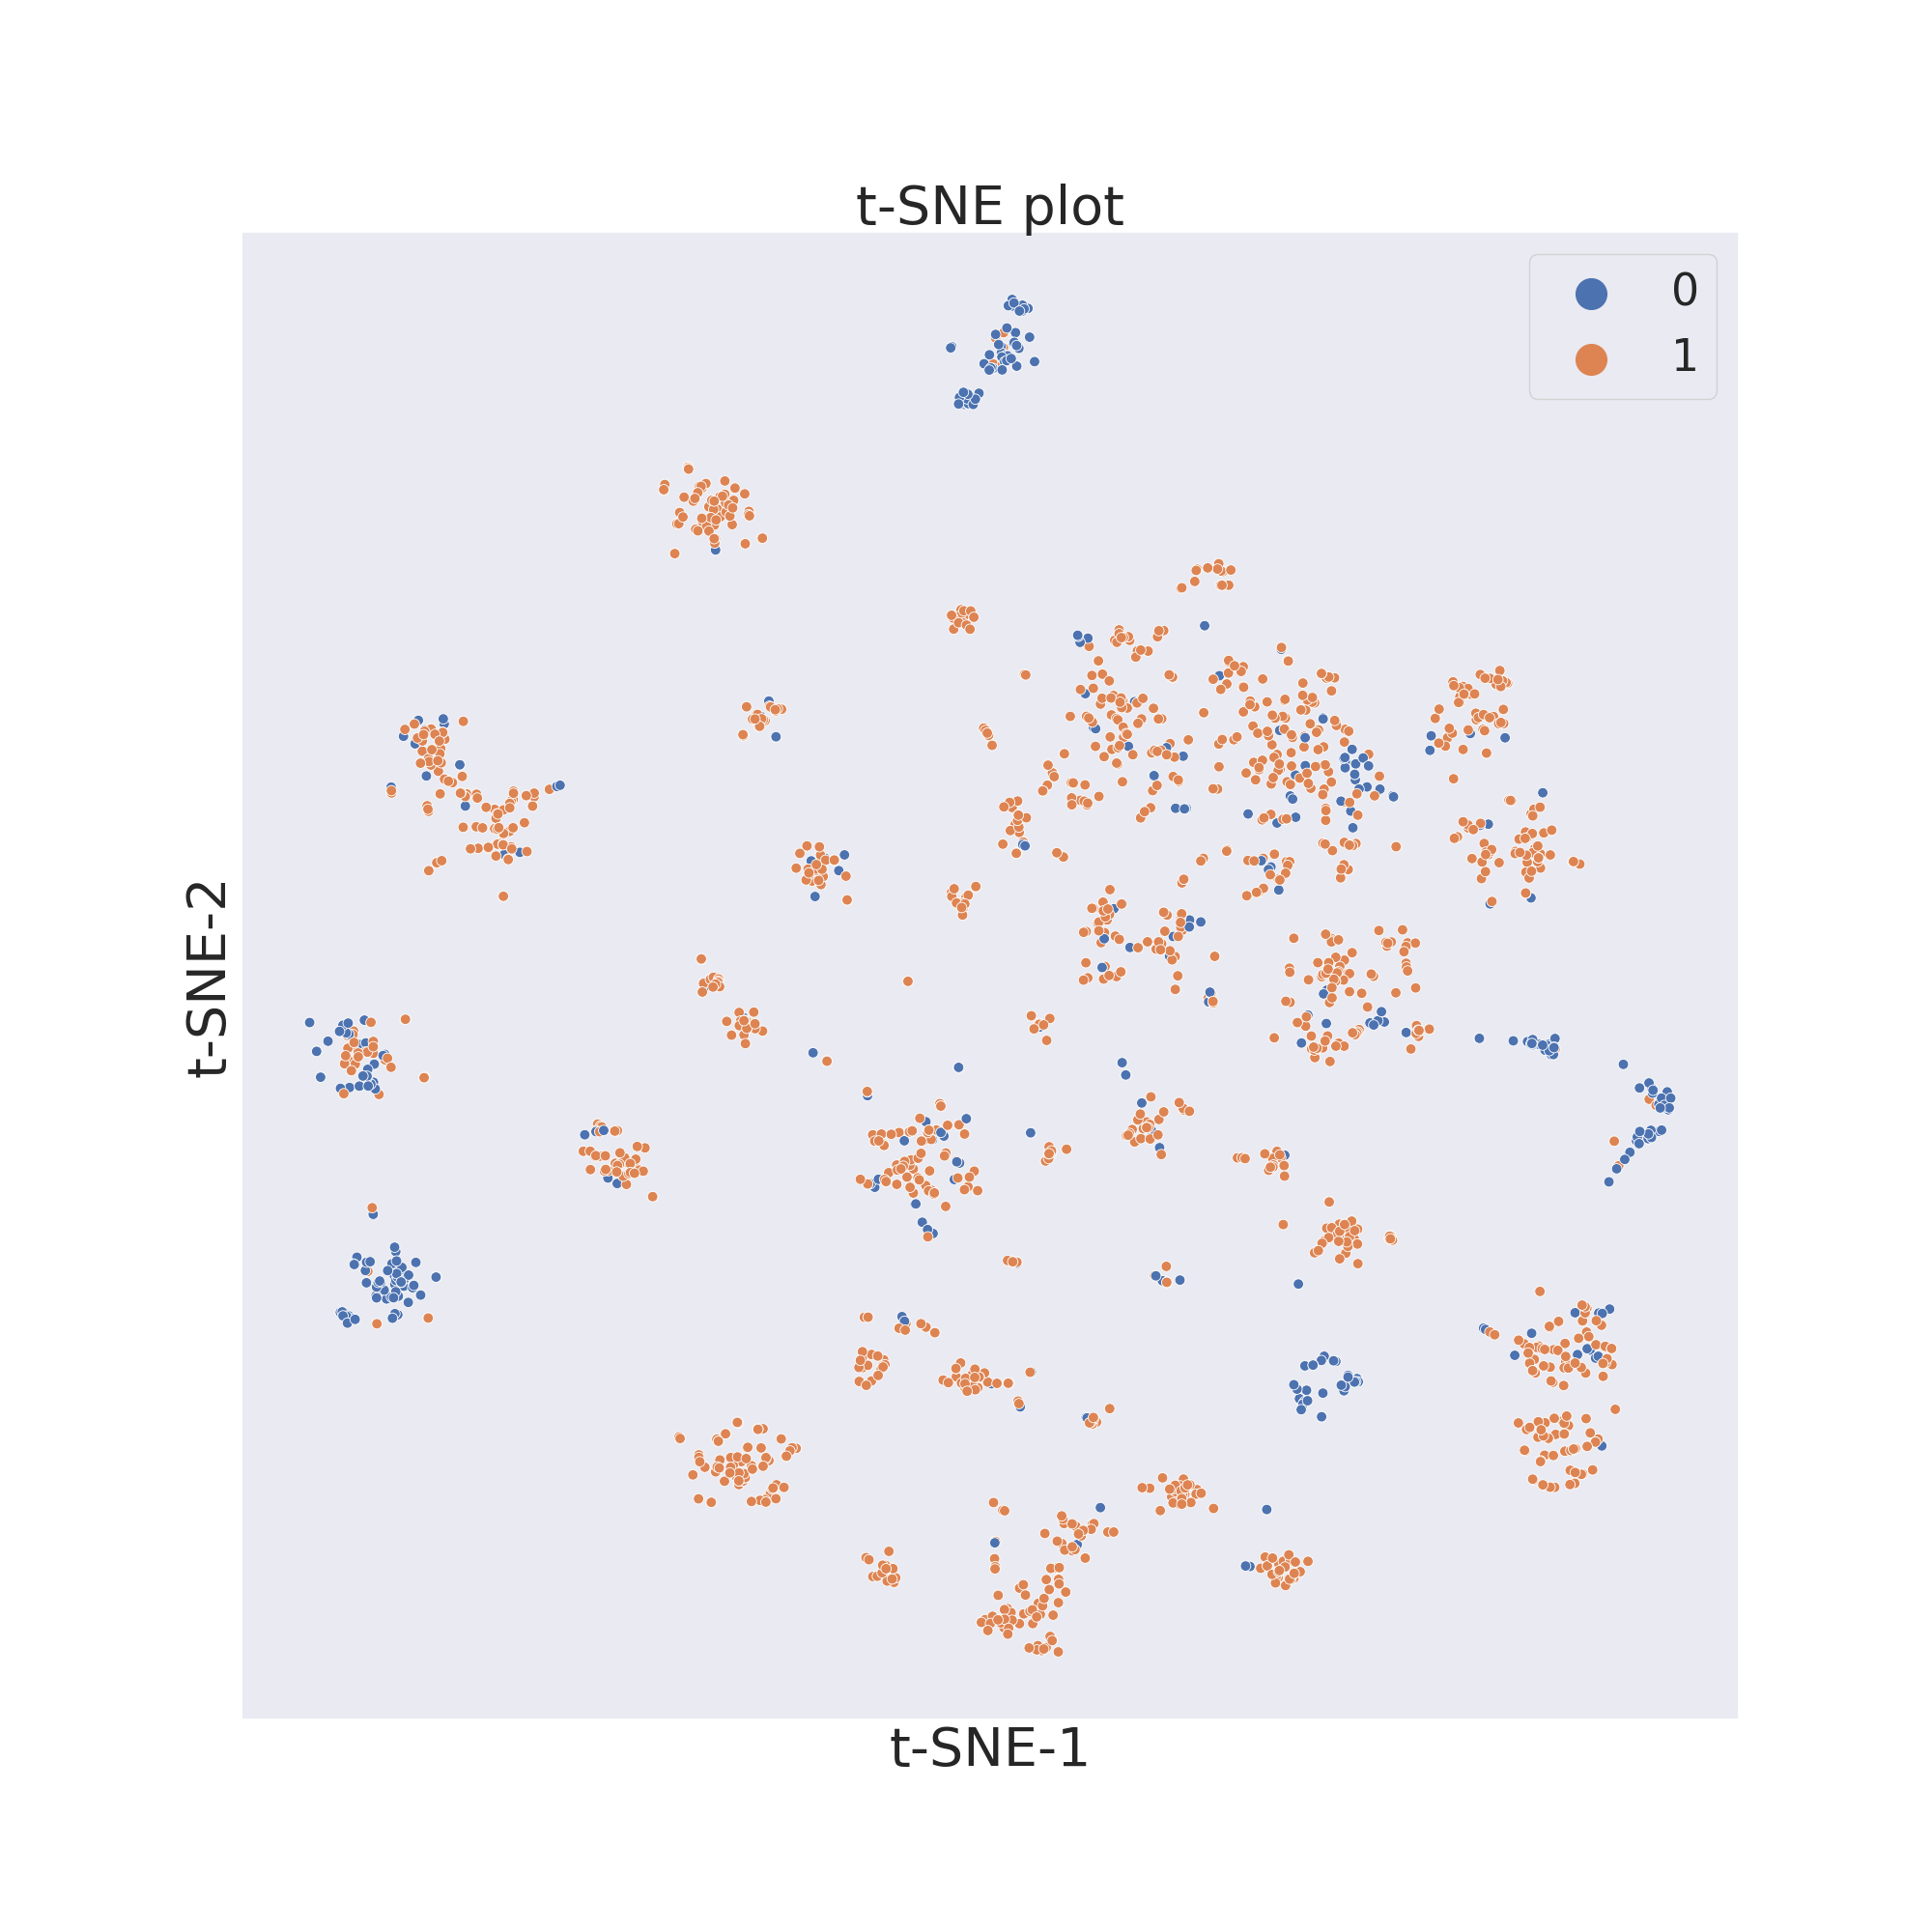
cp_BACE.tsne()
cp_BACE.visualize_plot()
Two important parameters of the tsne() method are perplexity and
pca. The former is a positive integer parameter which defines the size of
the neighbourhoods the algorithm will look for when analyzing the dataset. The
higher the value of perplexity the wider the analyzed neighbourhoods. The
recommended values for perplexity range from 5 to 50. The pca parameter
is a Boolean value which indicates if the data has to be preprocessed with PCA.
Its value is taken into account when plotting according to structural
similarities when each molecule is encoded with a long number of features.
Since t-SNE is computationally expensive, preprocessing the data can save
substantial amounts of time when generating plots, at the cost of losing some
of the molecular structural information.
UMAP
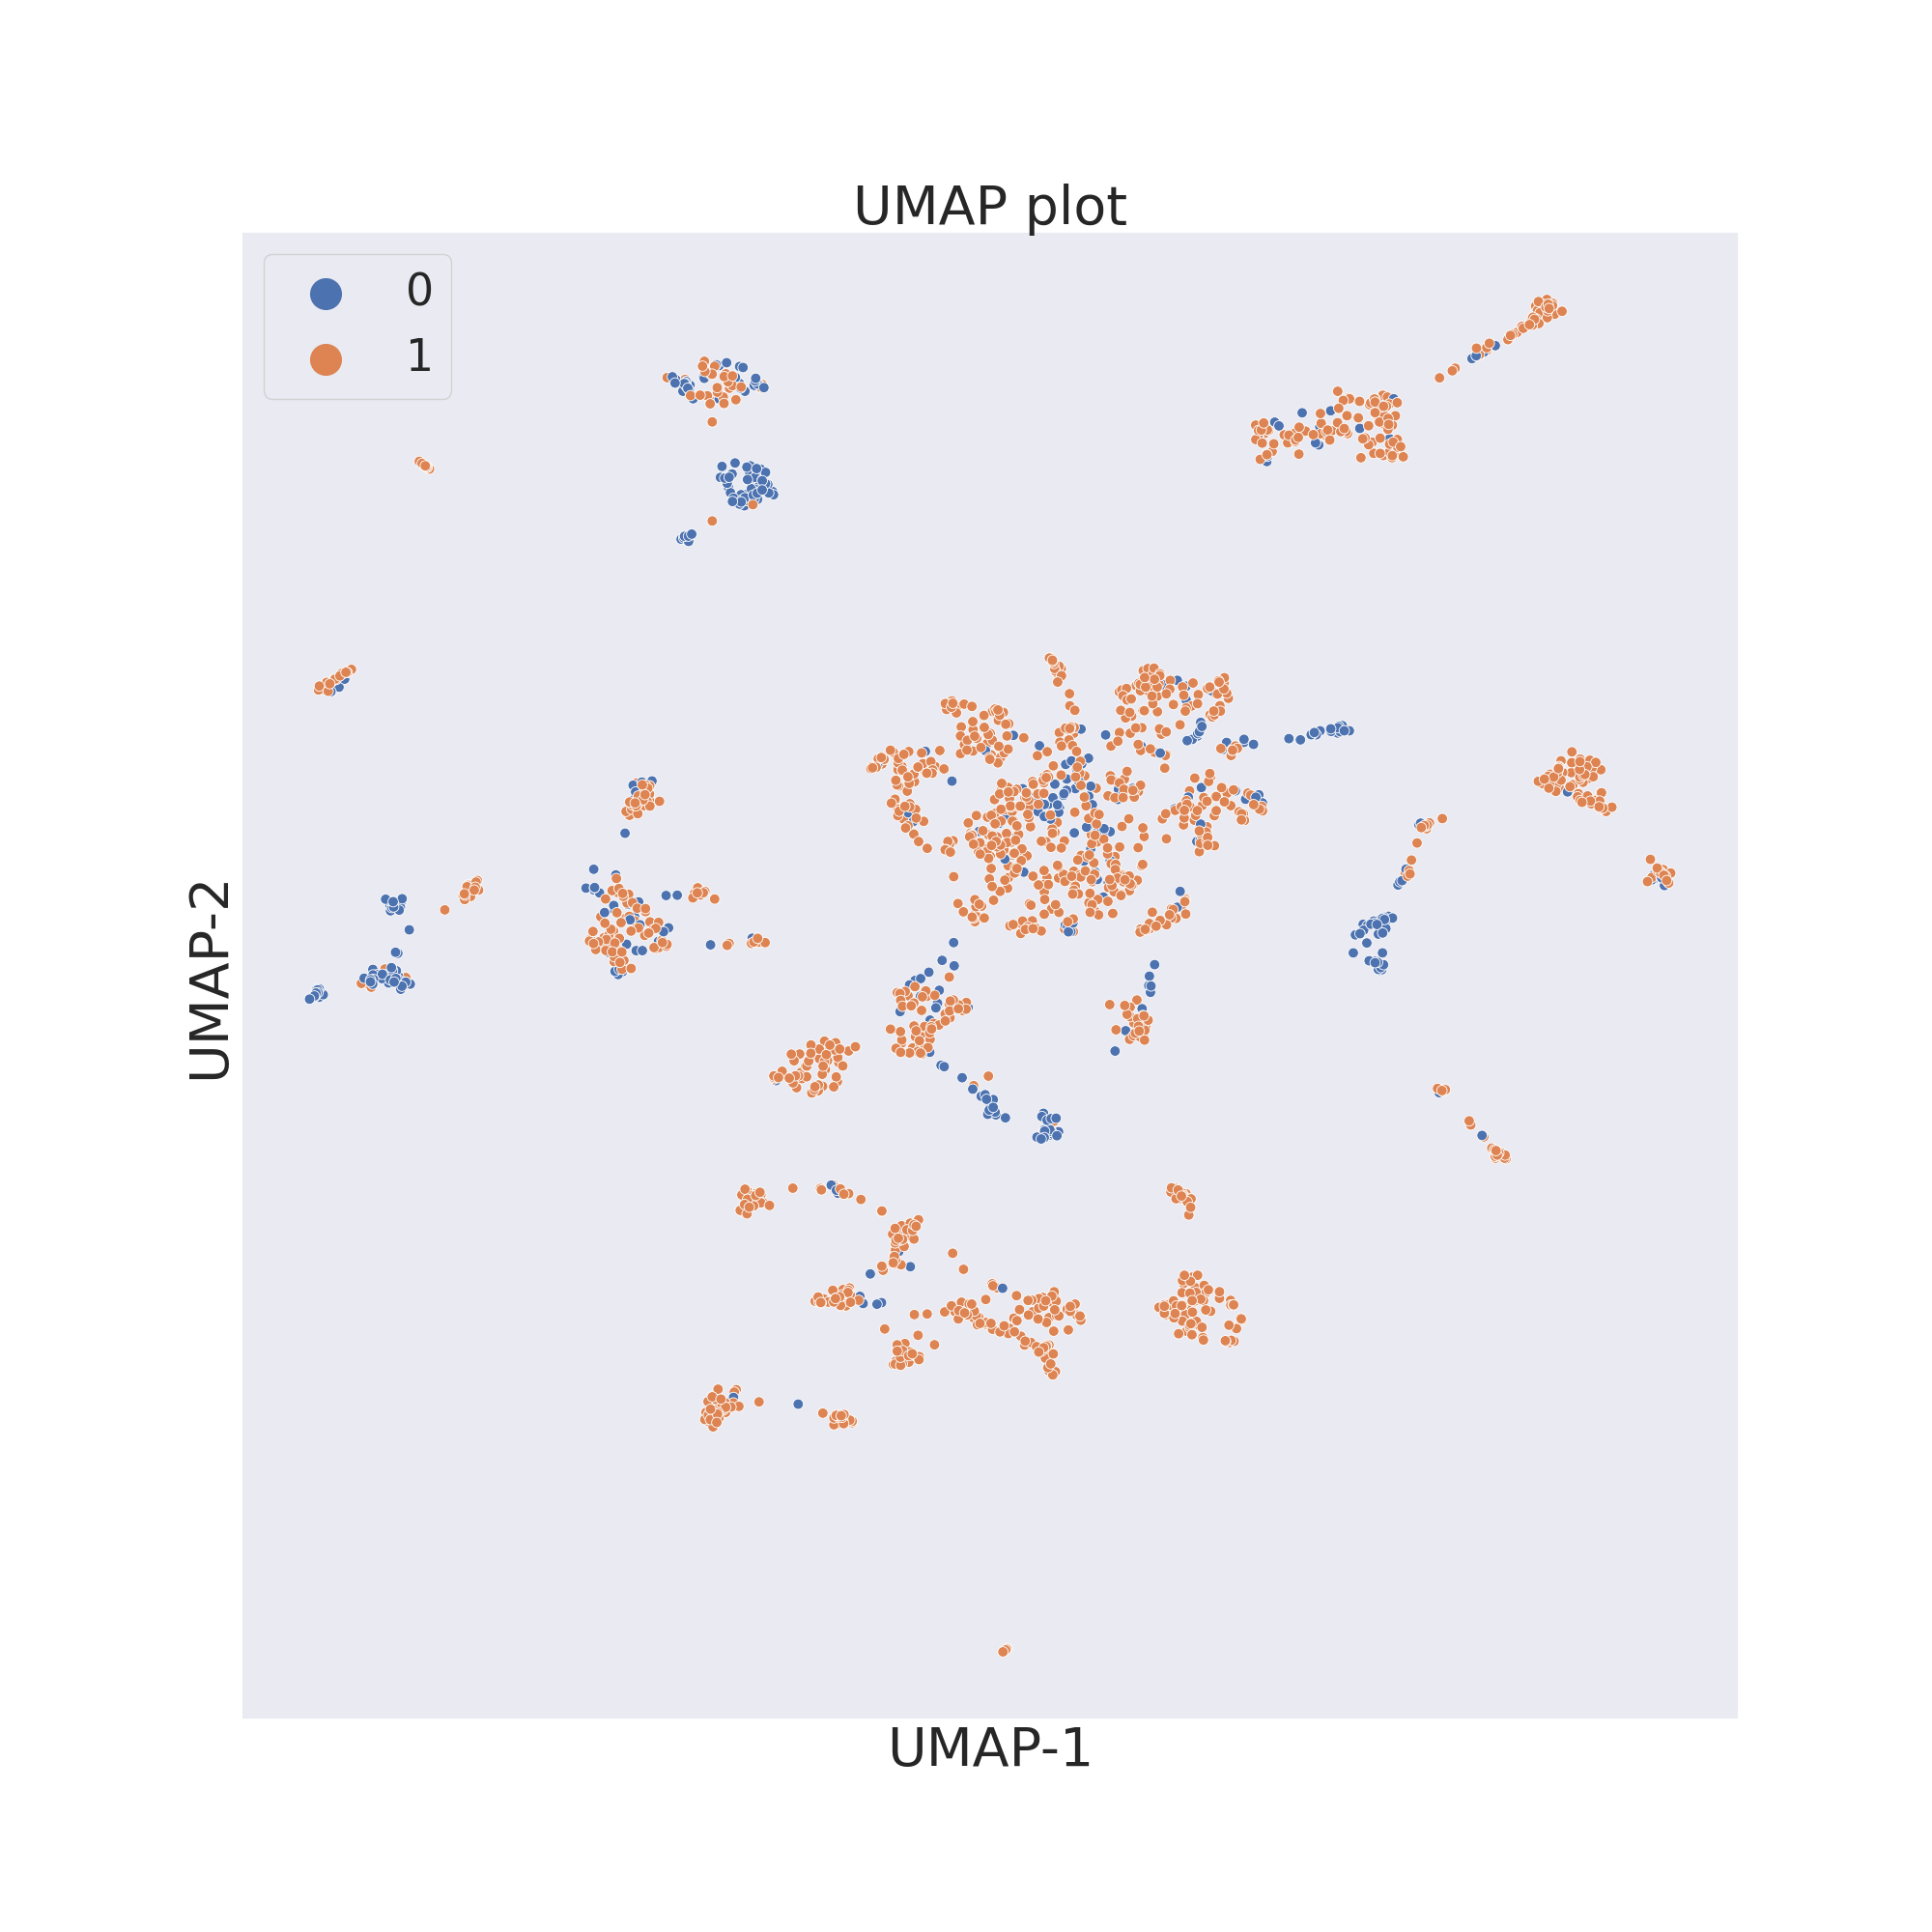
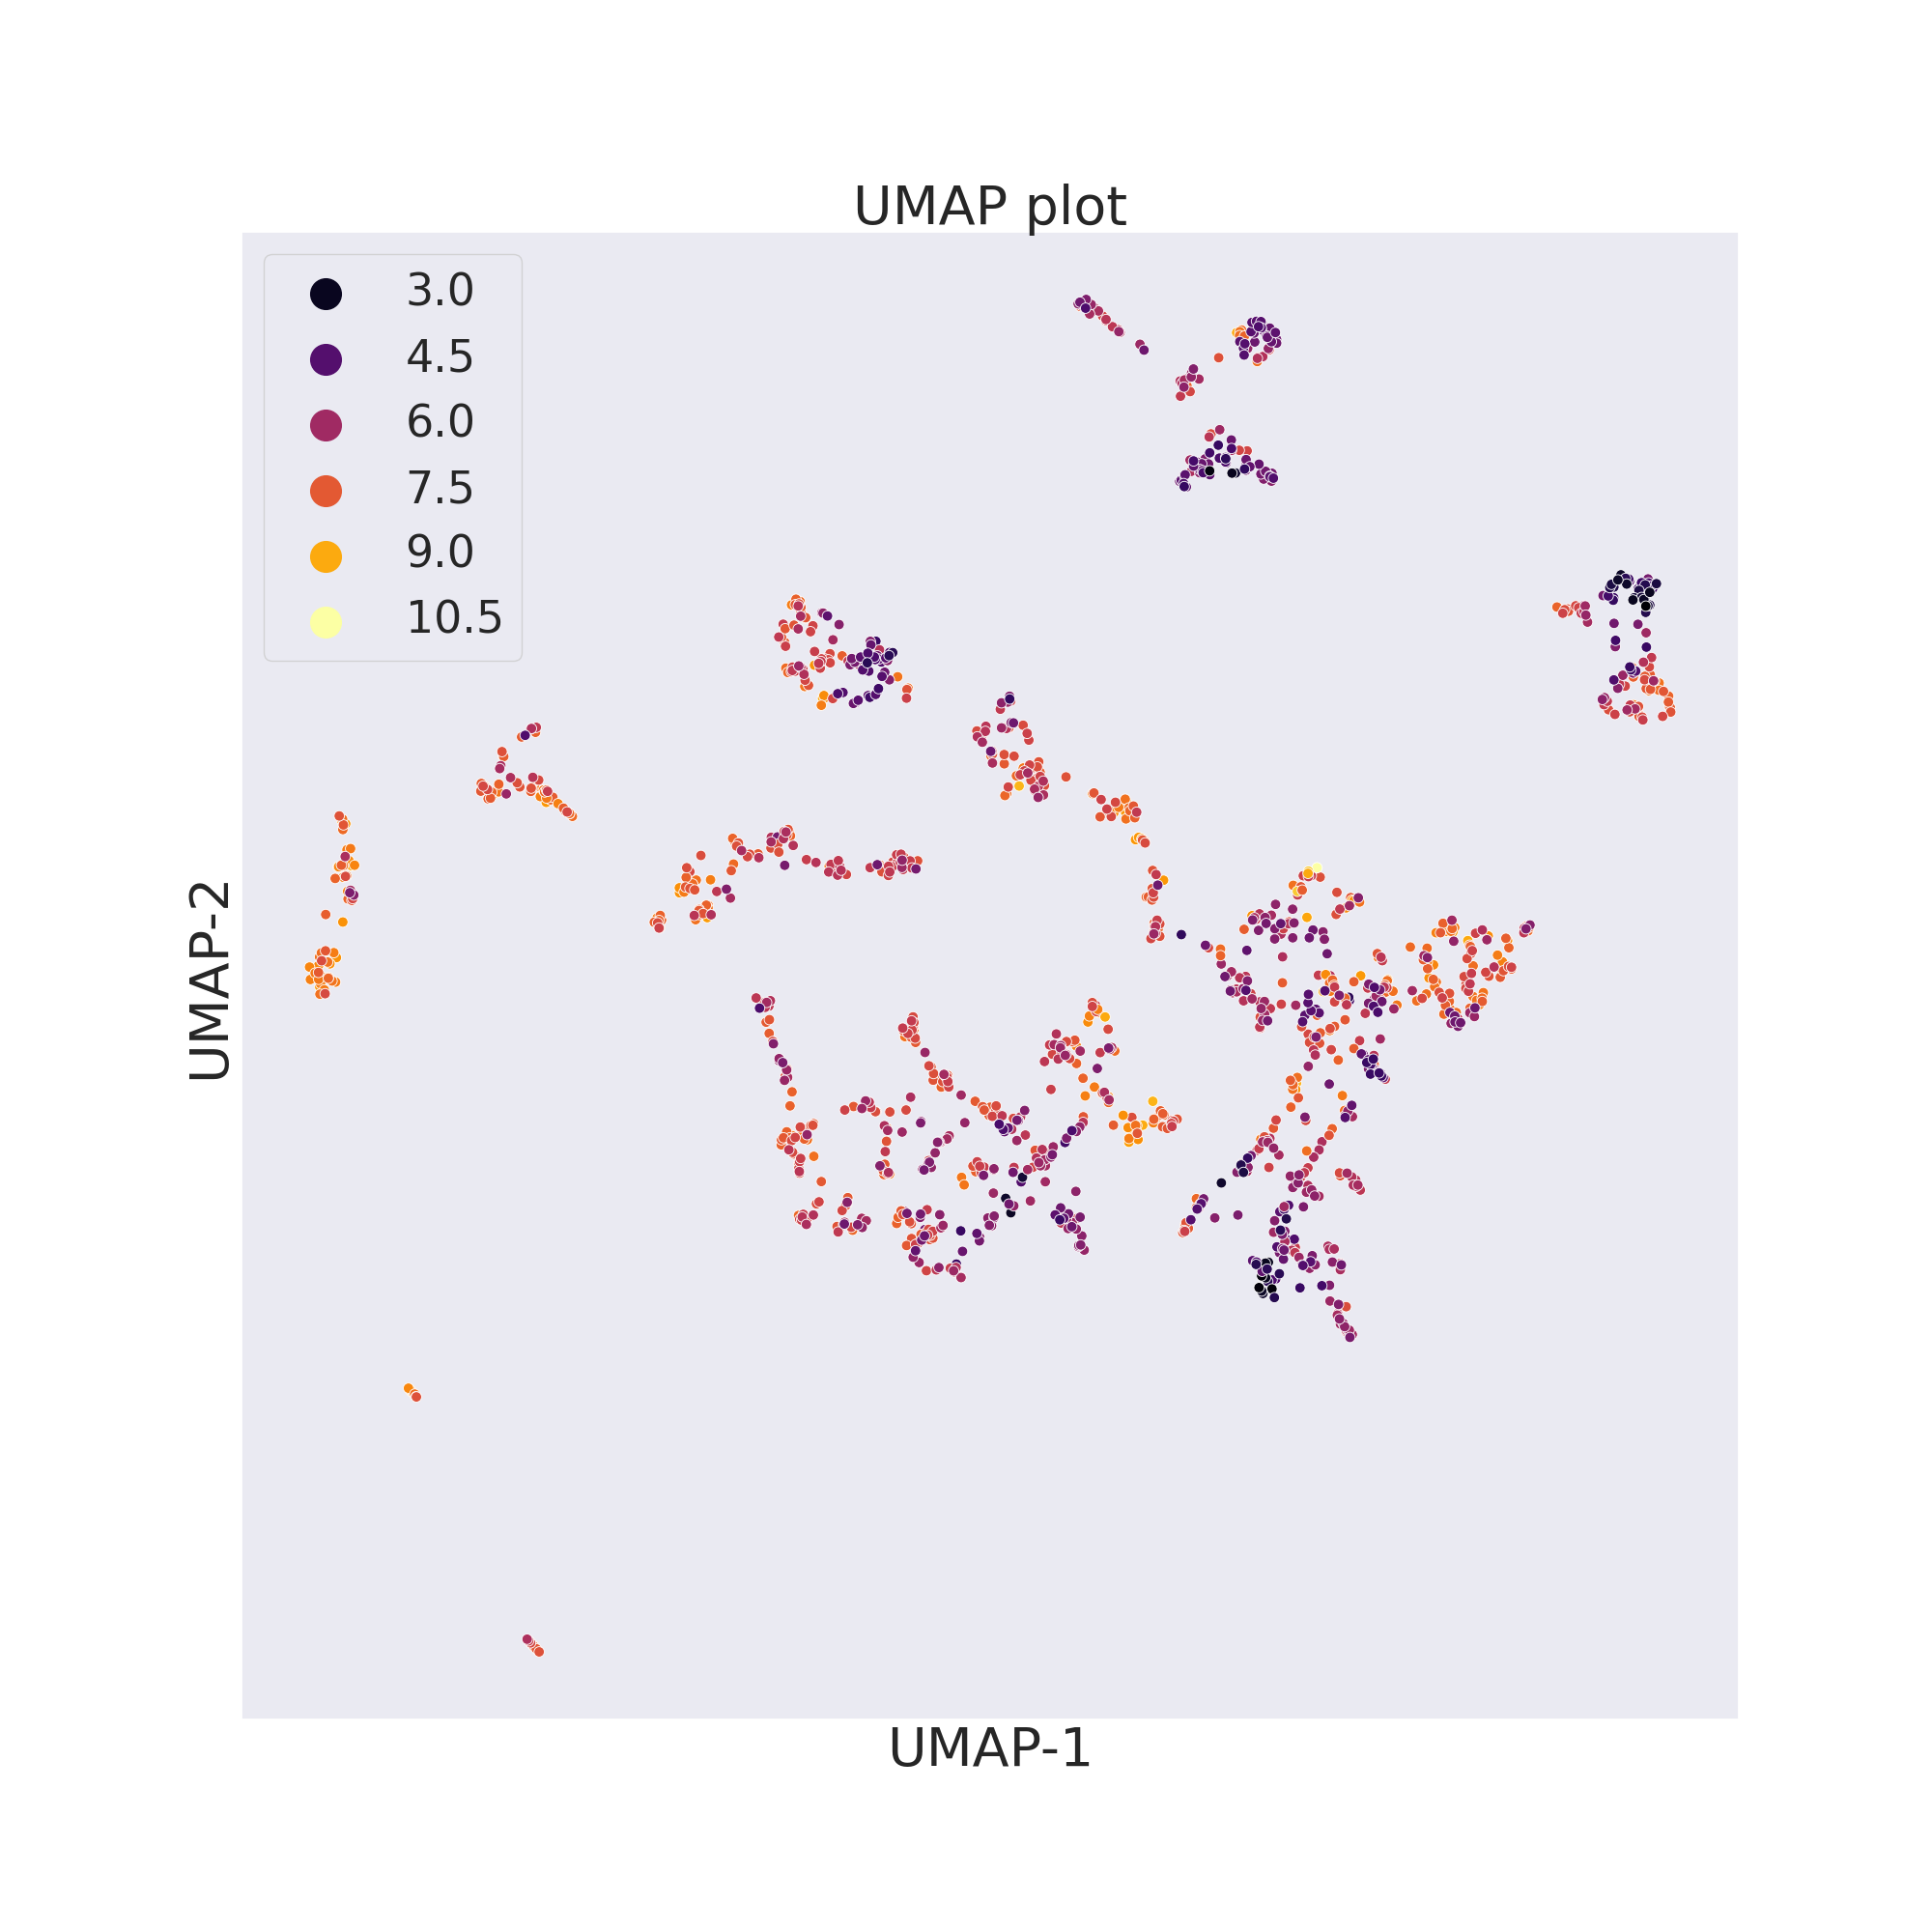
ChemPlot uses UMAP from the umap-learn package to reduce to only 2 the number of features of the molecular dataset. As t-SNE, UMAP looks at local neighbourhoods of molecules when it is reducing their dimensions. While this also results in 2D clusters of locally similar molecules, compared to t-SNE, UMAP retains more of the global structure of the dataset. Compared to t-SNE, furthermore, UMAP is much more computationally efficient and faster.
cp_BBBP.umap()
cp_BBBP.visualize_plot()
cp_BACE.umap()
cp_BACE.visualize_plot()
Two important parameters of the umap() method are n_neighbors,
min_dist and pca. The former is a positive integer parameter which constrains the
size of the local neighbourhood the algorithm will look for when analyzing the
dataset. Low values of n_neighbors will make ChemPlot visualize very local
structures. The min_dist parameter is a value which ranges from 0.0 to
0.99. It provides the minimum distance apart that points are allowed to be in
the 2D graph. The pca parameter is a Boolean value which indicates if the
data has to be preprocessed with PCA.
References: