Similarity Analysis
In this example we will use two molecular datasets: the BBBP (blood-brain barrier penetration) dataset [1], already used in the previous section, and the BACE (β-secretase inhibitors) dataset [2]. While the target values of the molecules collected by the BBBP dataset are binary, and therefore discrete, the target values of the molecules collected by the BACE dataset are continuous.
from chemplot import Plotter, load_data

data_BBBP = load_data("BBBP")
data_BACE = load_data("BACE")
In order to plot a subset of the chemical space over a 2D graph it is necessary to define the metric according to which a certain molecule will be plotted on a certain location of the graph. What ChemPlot uses when deciding which molecules need to be plotted where is the concept of “molecular similarity”. Similar molecules will be displayed closer together, while molecules which are less similar will be displayed further apart.
ChemPlot distinguishes between two definitions of molecular similarity: structural and tailored [3].
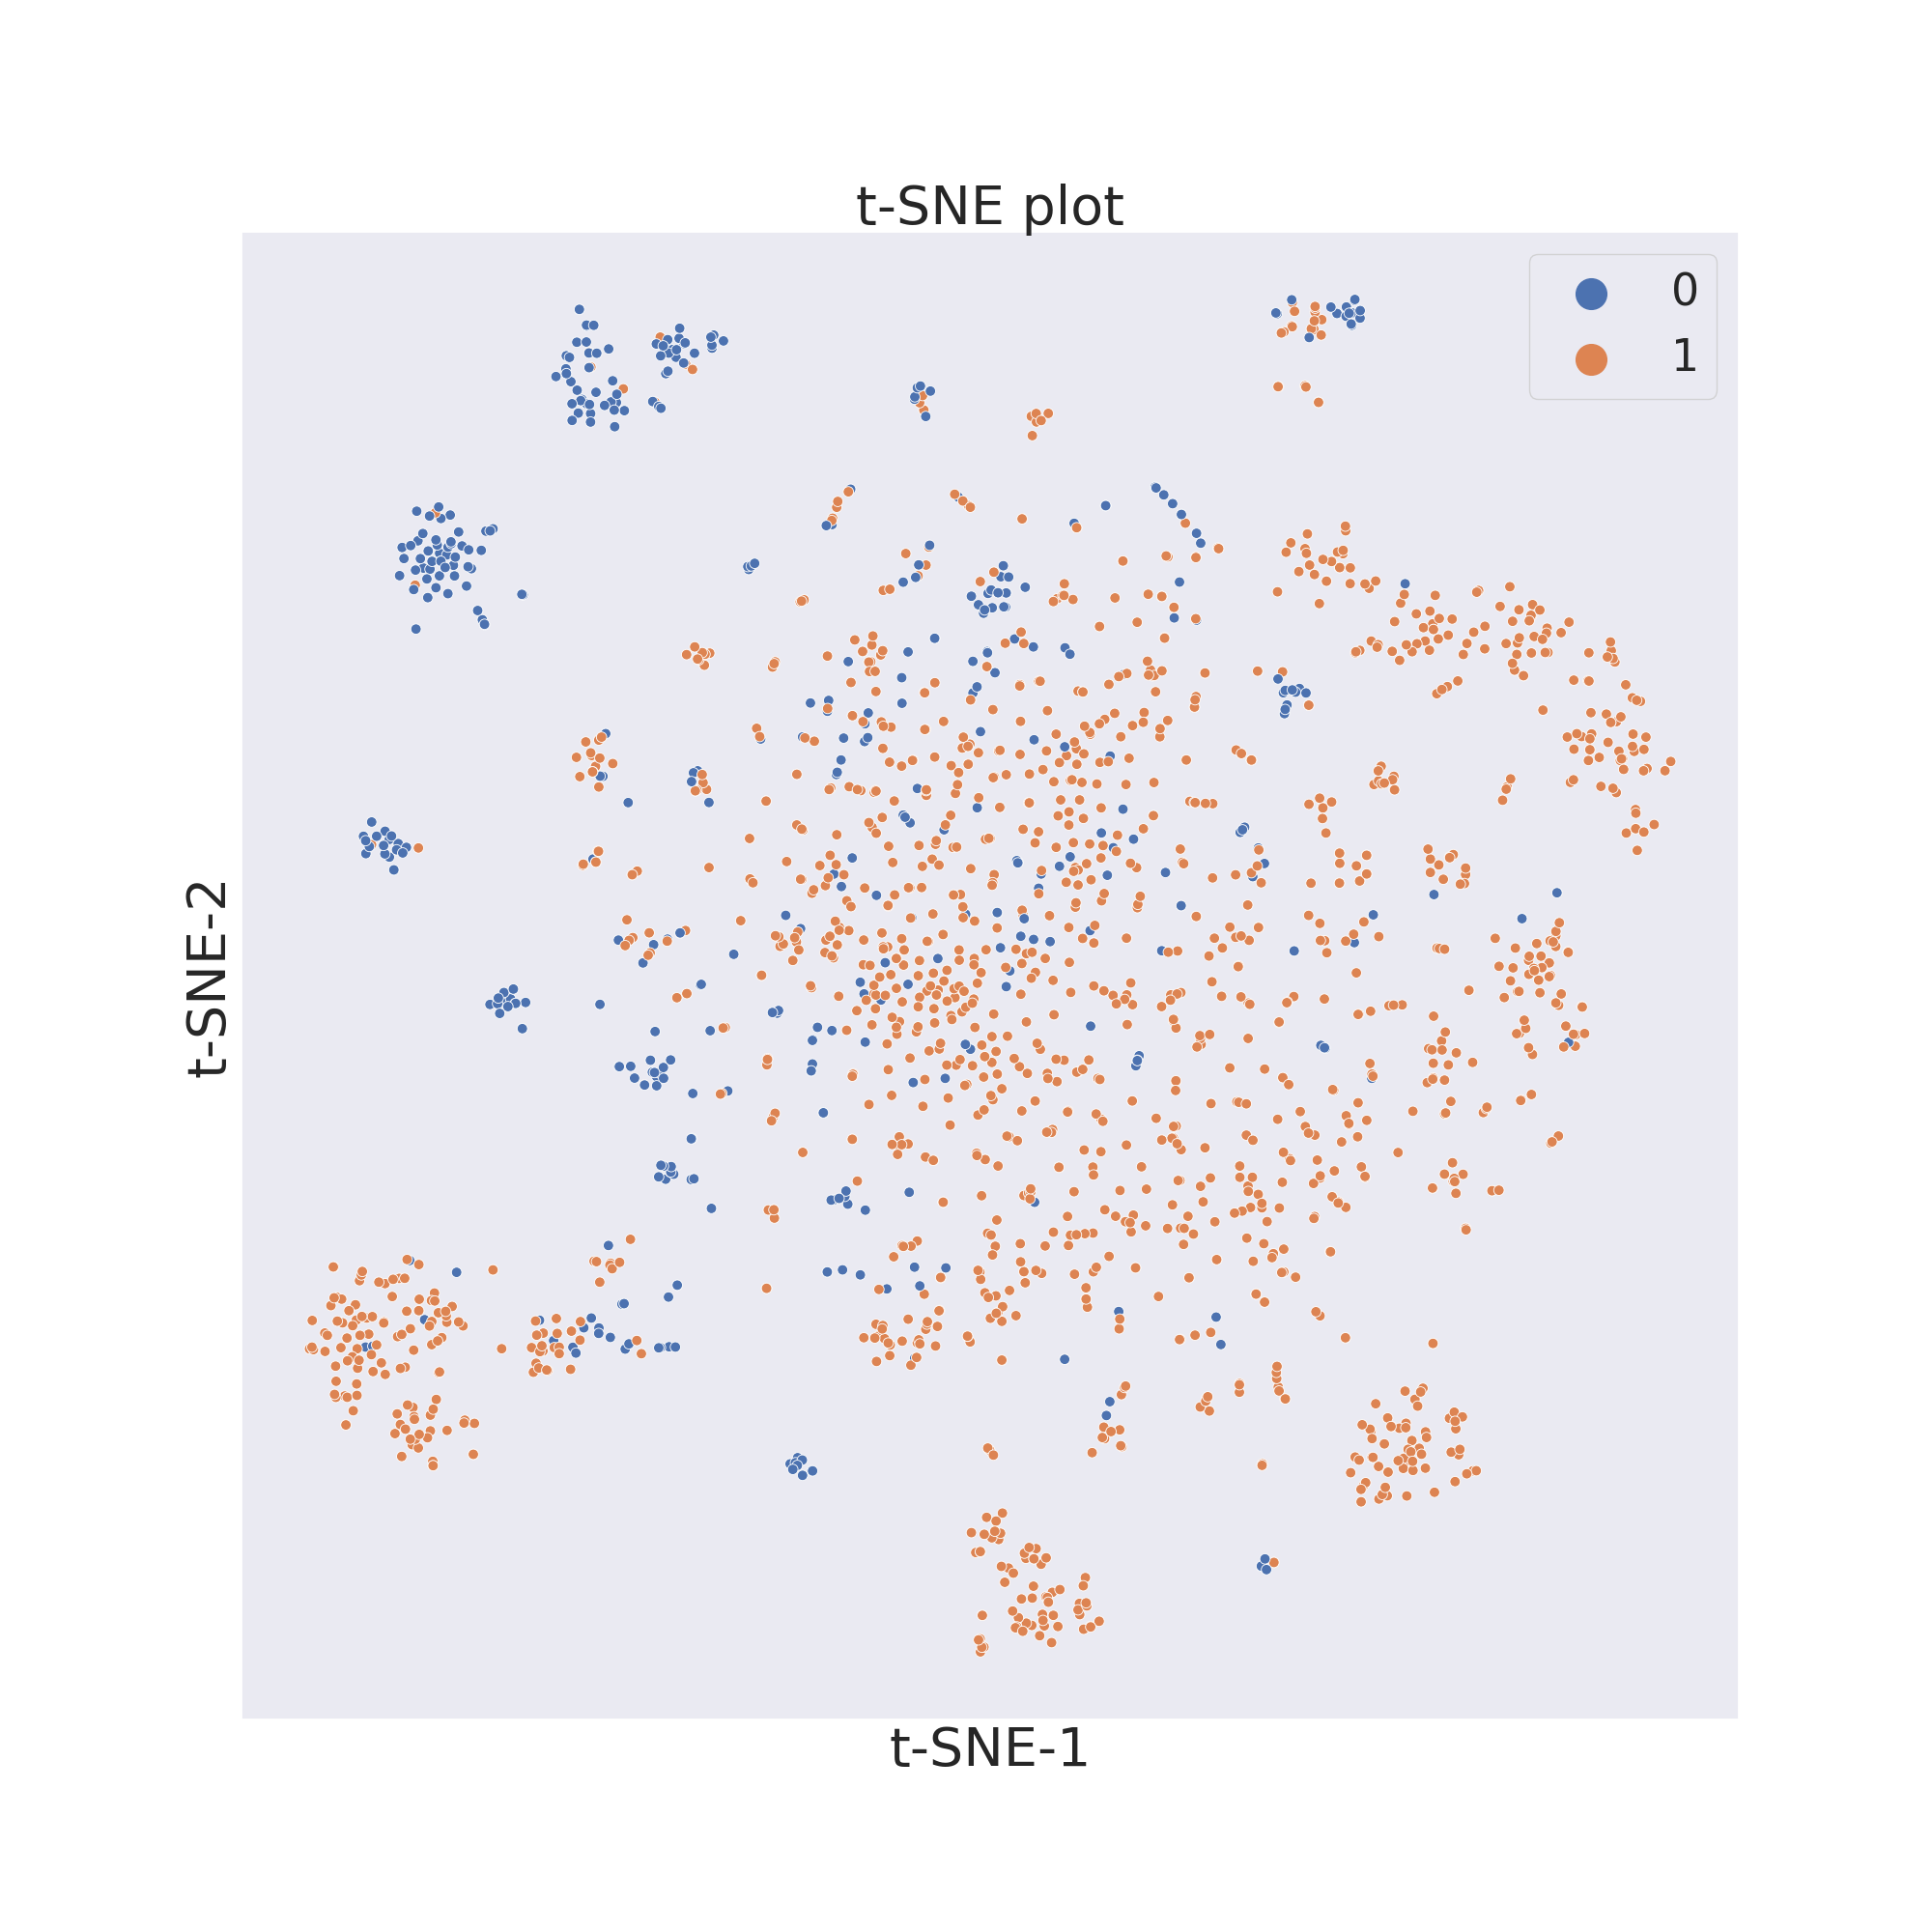
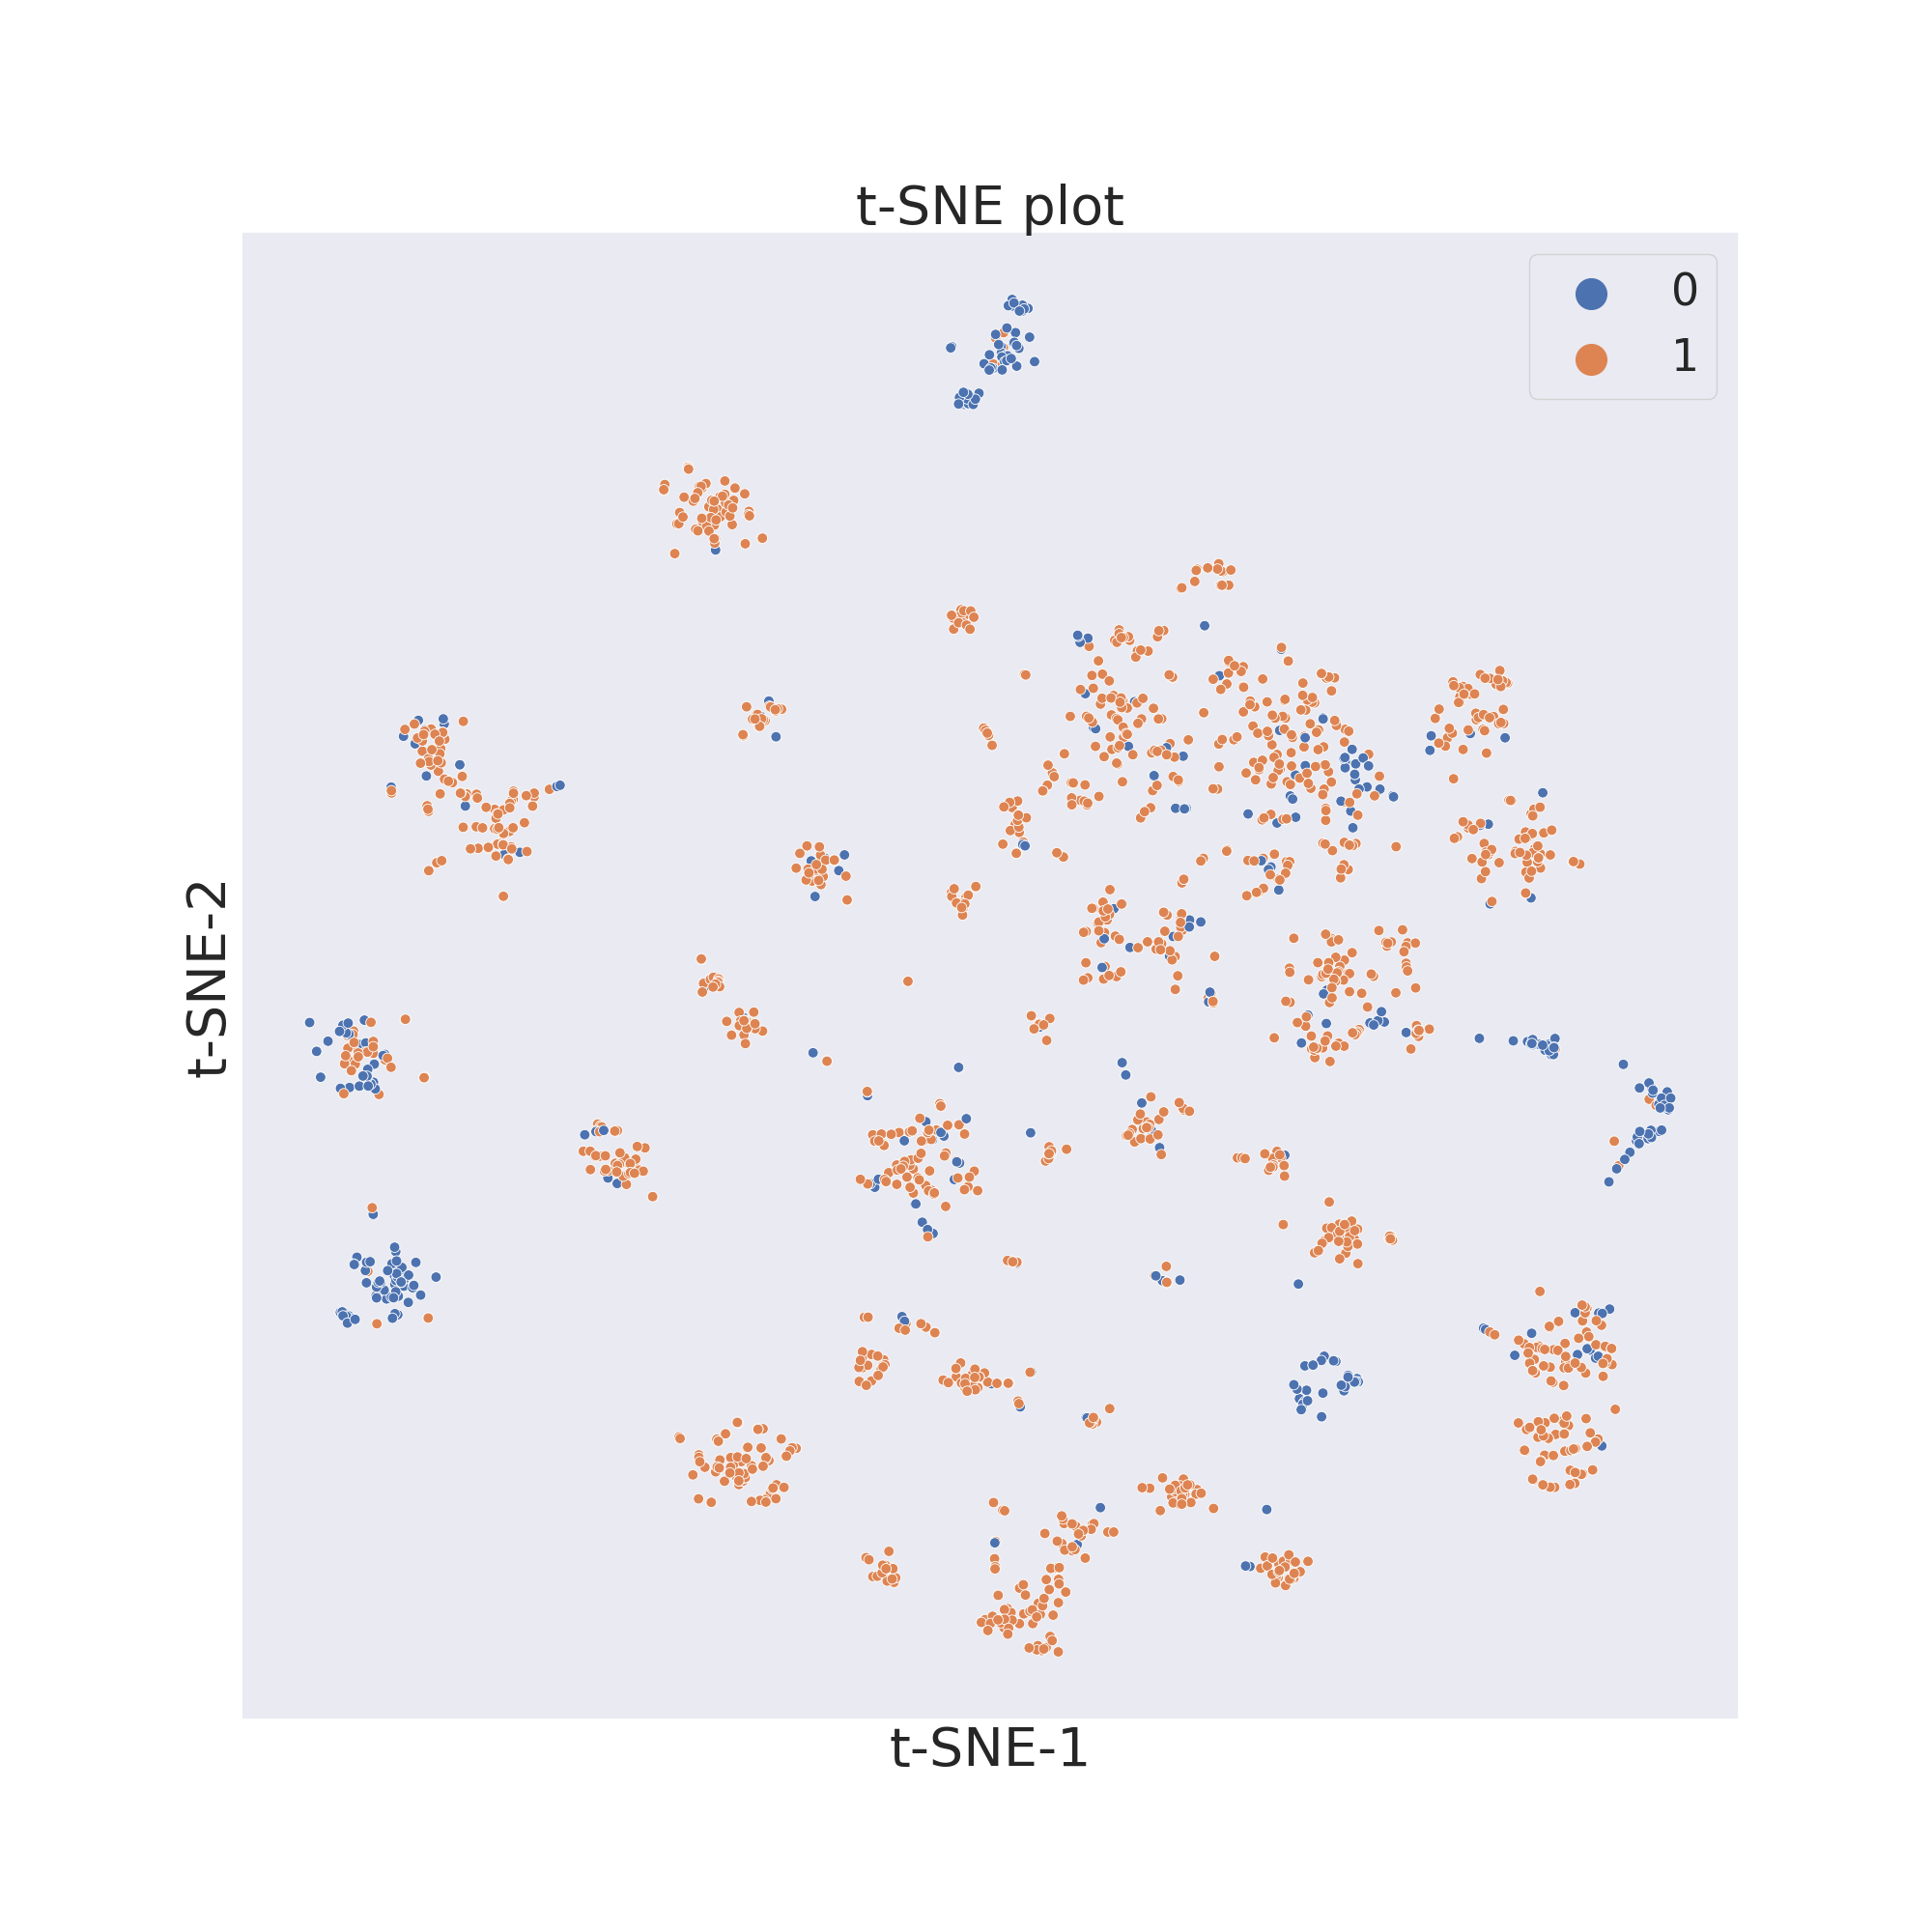
Structural
Structural similarity is defined as the number and dimensions of “fragments”
different molecules share. Molecular fragments are groups of atoms and bonds
which a molecule can be divided into. The higher the number and dimensions of
fragments two molecules share the more similar they are according to structural
similarity. ChemPlot uses Extended-Connectivity Fingerprints (ECFPs) [4] to
define which fragments are present in each molecule. To create a Plotter
object which visualizes the desired molecules according to structural
similarity we need to pass the keyword “structural” as the sim_type
parameter when constructing the object.
cp_BBBP = Plotter.from_smiles(data_BBBP["smiles"], target=data_BBBP["target"], target_type="C", sim_type="structural")
cp_BACE = Plotter.from_smiles(data_BACE["smiles"], target=data_BACE["target"], target_type="R", sim_type="structural")
cp_BBBP.tsne()
cp_BBBP.visualize_plot()
cp_BACE.tsne()
cp_BACE.visualize_plot()
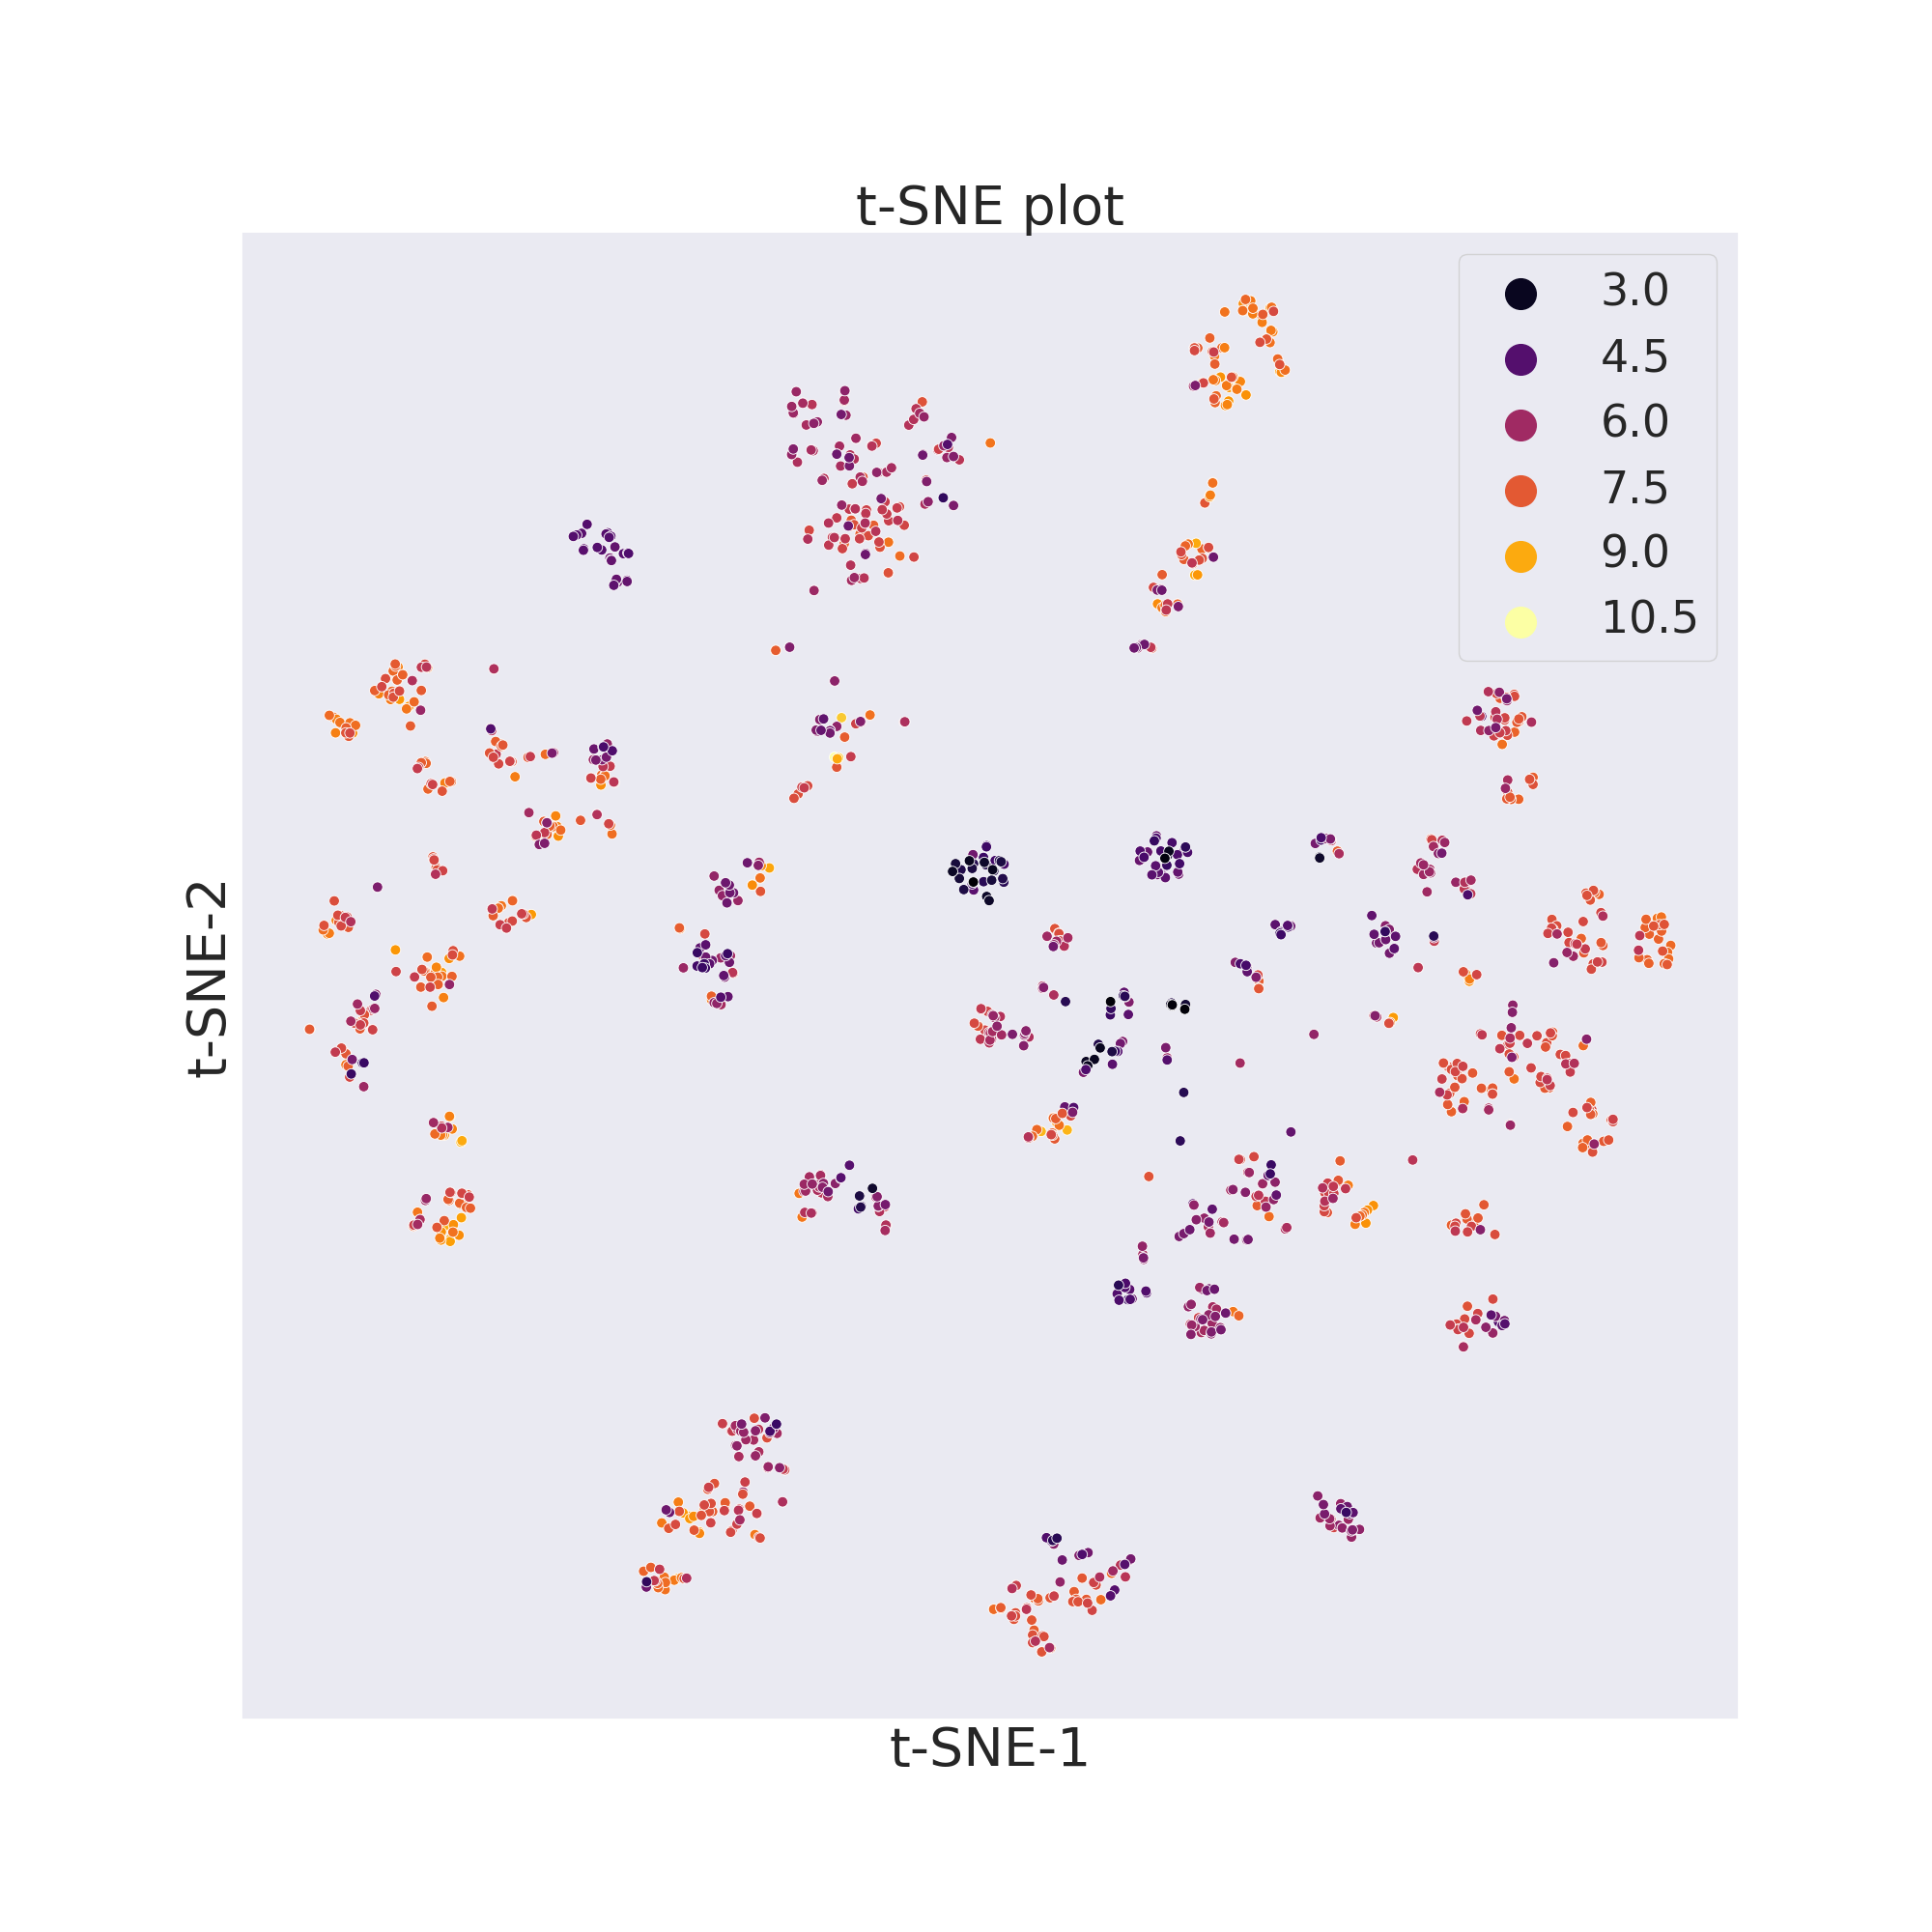
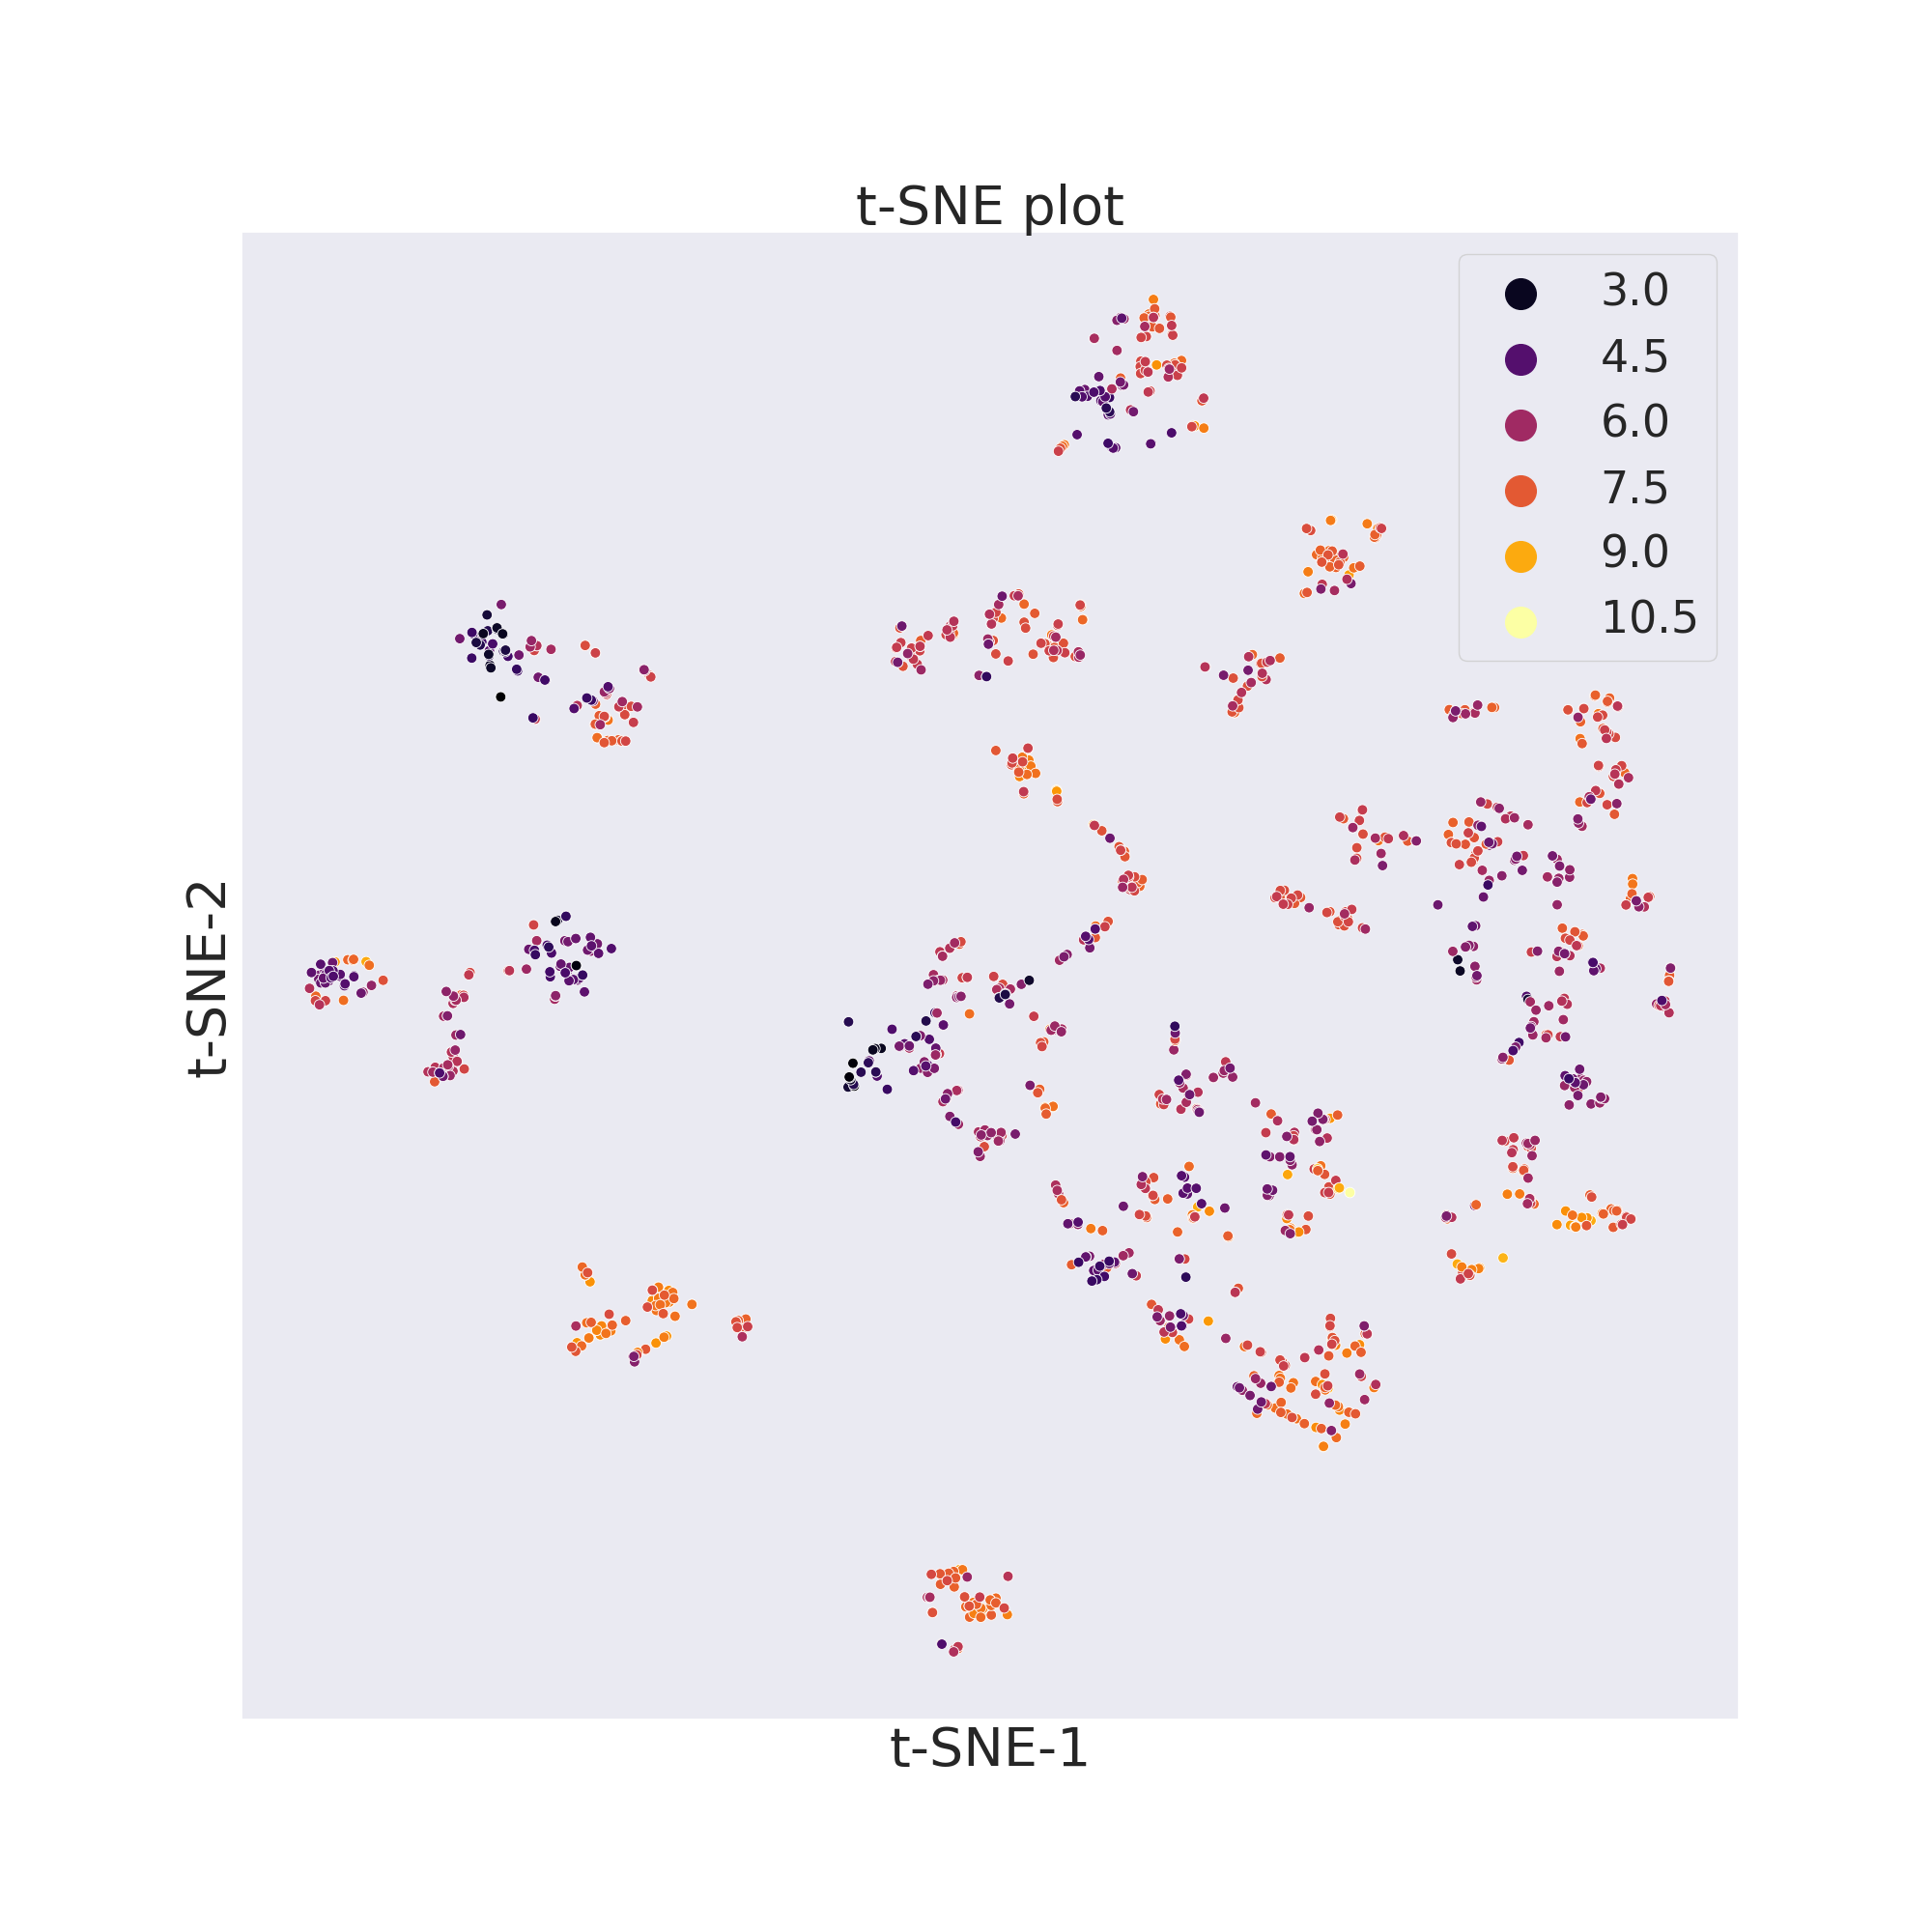
Tailored
Tailored similarity is a similarity metric between molecules which takes into
account the target property for determining if two molecules are similar or
not. Indeed after a general set of descriptors is calculated for each molecule,
a subset of those is selected by optimizing for the target property. Finally
depending on the values of the subset ChemPlot can decide which
molecules are more similar than others. To create a Plotter object which
visualizes the desired molecules according to structural similarity, we need to
pass the keyword “tailored” as the sim_type parameter when constructing the
object. Since “tailored” is the default value of sim_type if a list of
target values is passed in construction, in the following example we could have
omitted the last parameter and still have got the same objects.
cp_BBBP = Plotter.from_smiles(data_BBBP["smiles"], target=data_BBBP["target"], target_type="C", sim_type="tailored")
cp_BACE = Plotter.from_smiles(data_BACE["smiles"], target=data_BACE["target"], target_type="R", sim_type="tailored")
cp_BBBP.tsne()
cp_BBBP.visualize_plot()
cp_BACE.tsne()
cp_BACE.visualize_plot()
References: